The Energy Flip
The Move to Cleaner Energy in the United States
Telling Stories with Data - Fall 2025


Overview
The United States has a storied history in fossil fuel production and consumption. In 1859, in a small town north of Pittsburgh called Titusville, Pennsylvania, people flocked to the first oil well in the United States hoping to get rich in the first oil boom. Less than 25 years later, the United States alone was credited with supplying 85% of the world's crude oil supply, and kerosene was the United States' 4th largest export. Oil and natural gas continued to play a major part in foreign policy and international relations throughout the 20th century.

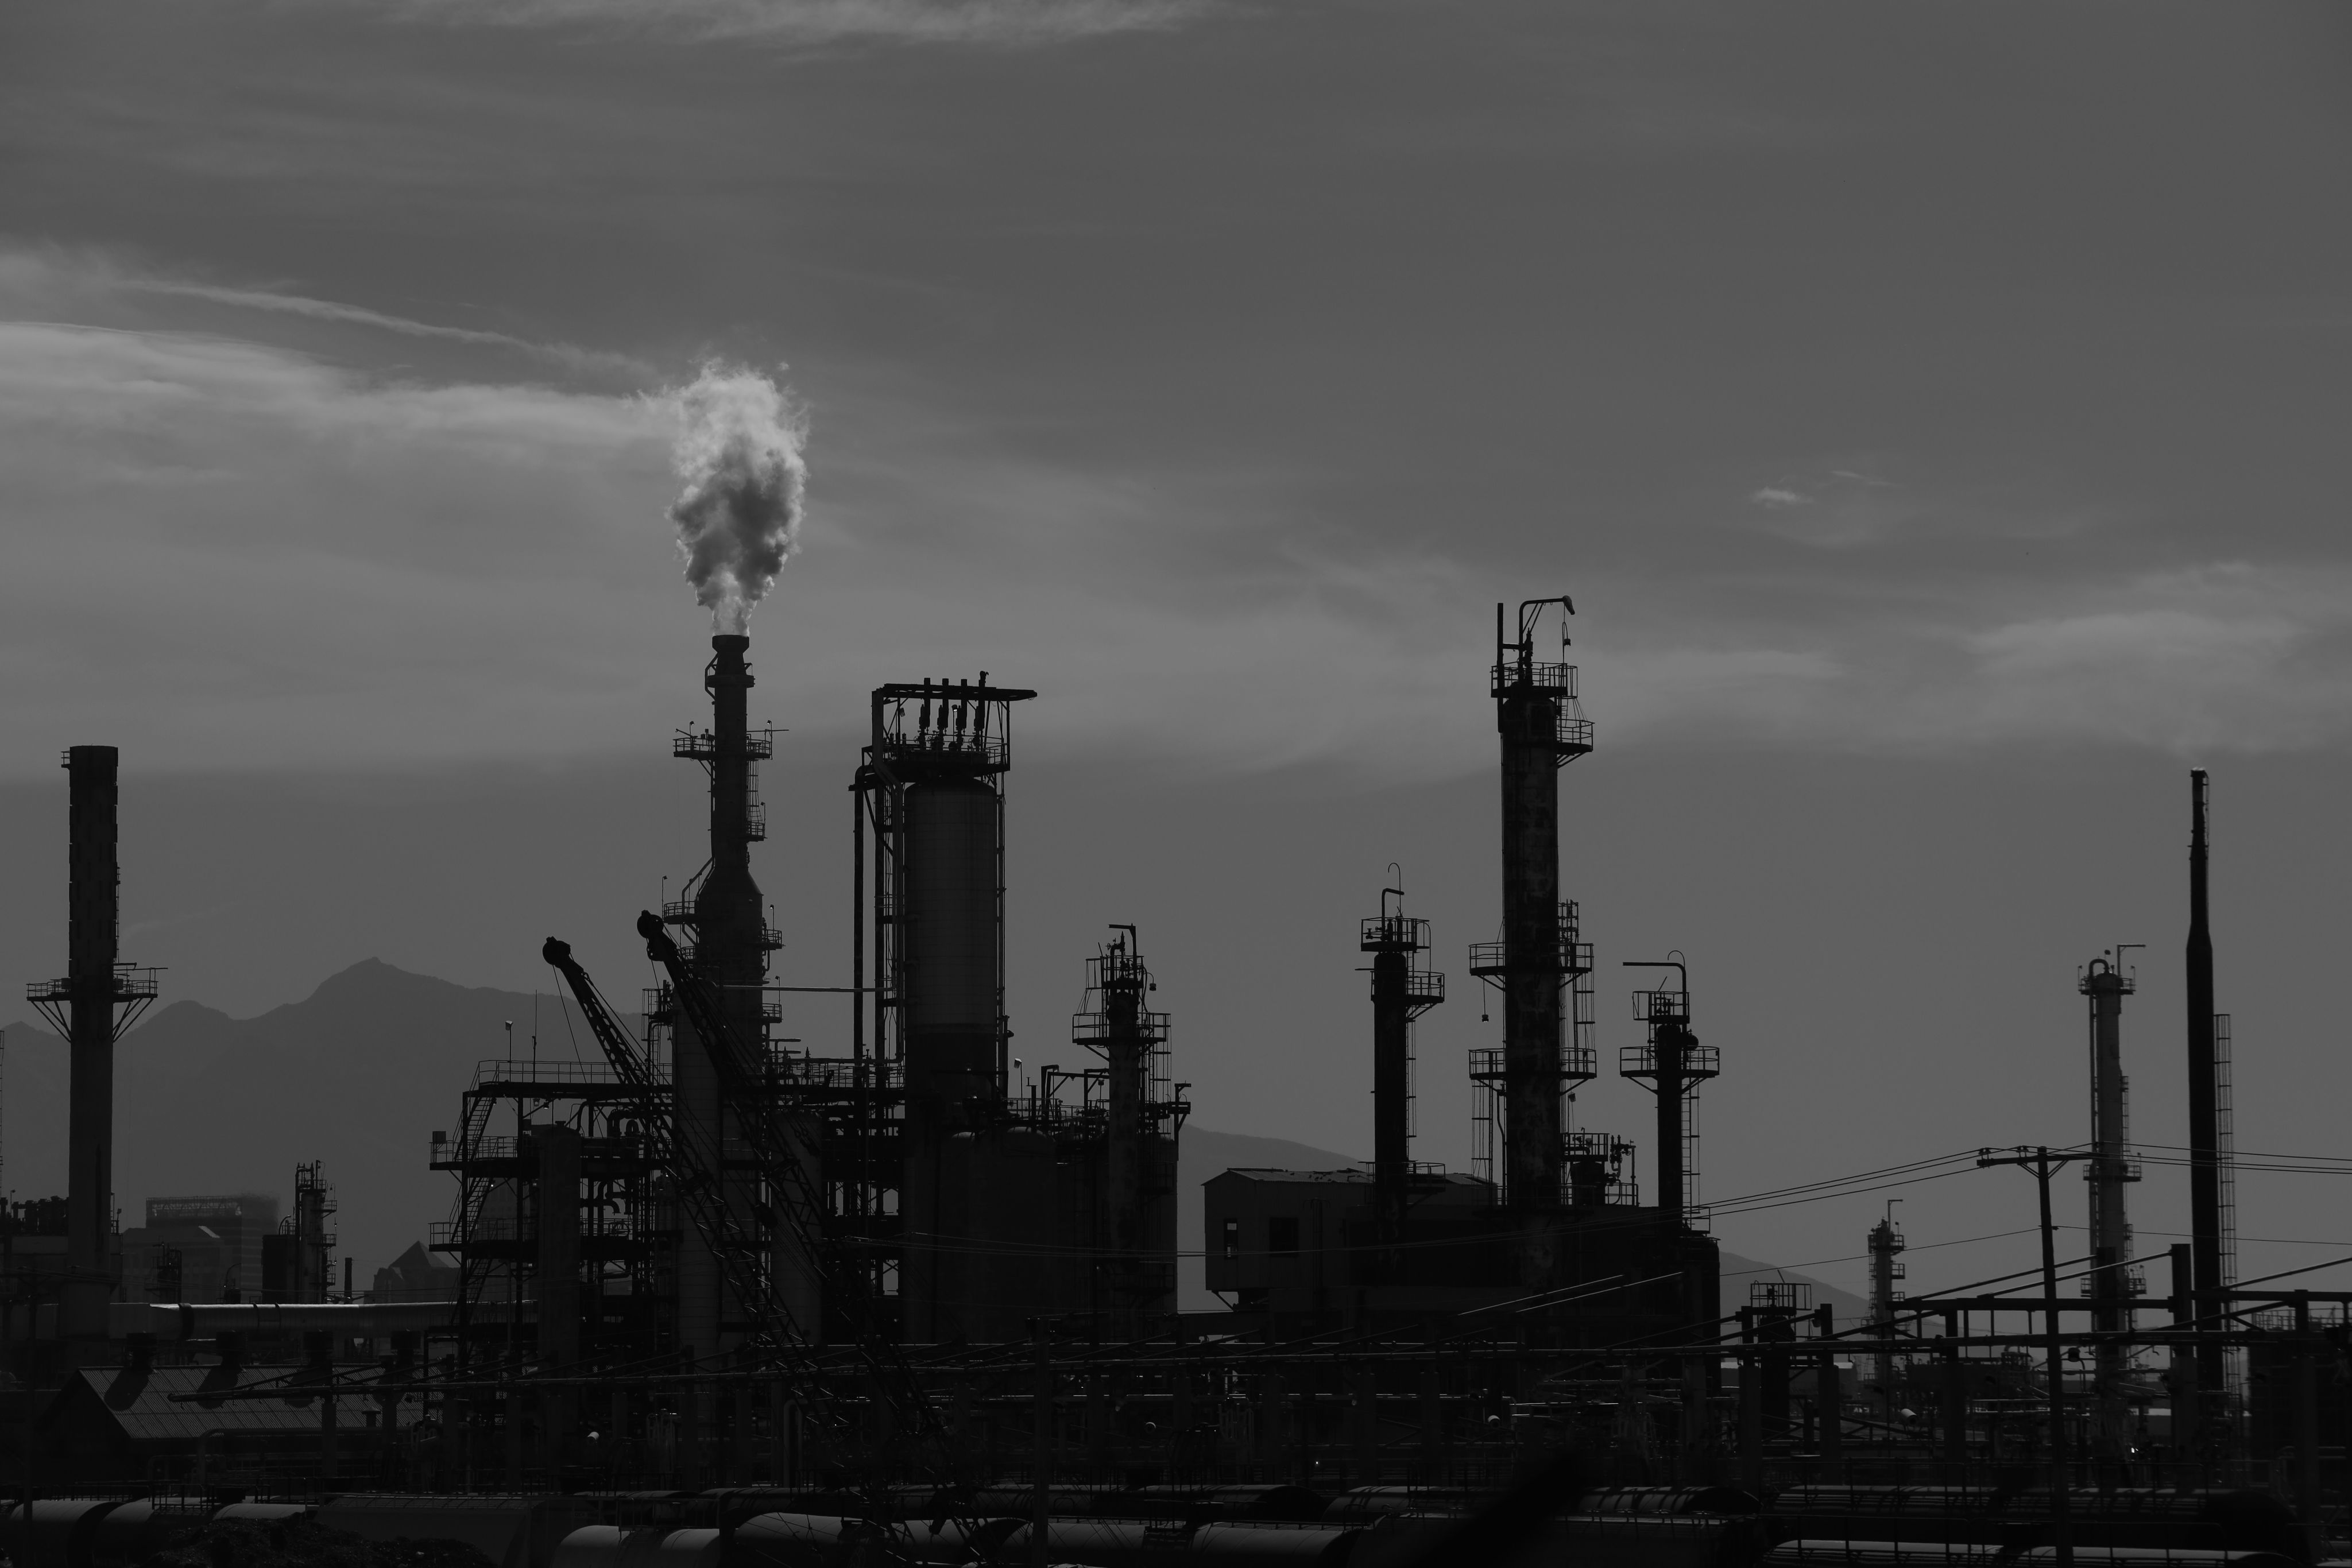
Photo by Danny Burke on Unsplash
Photo by Danny Burke on Unsplash
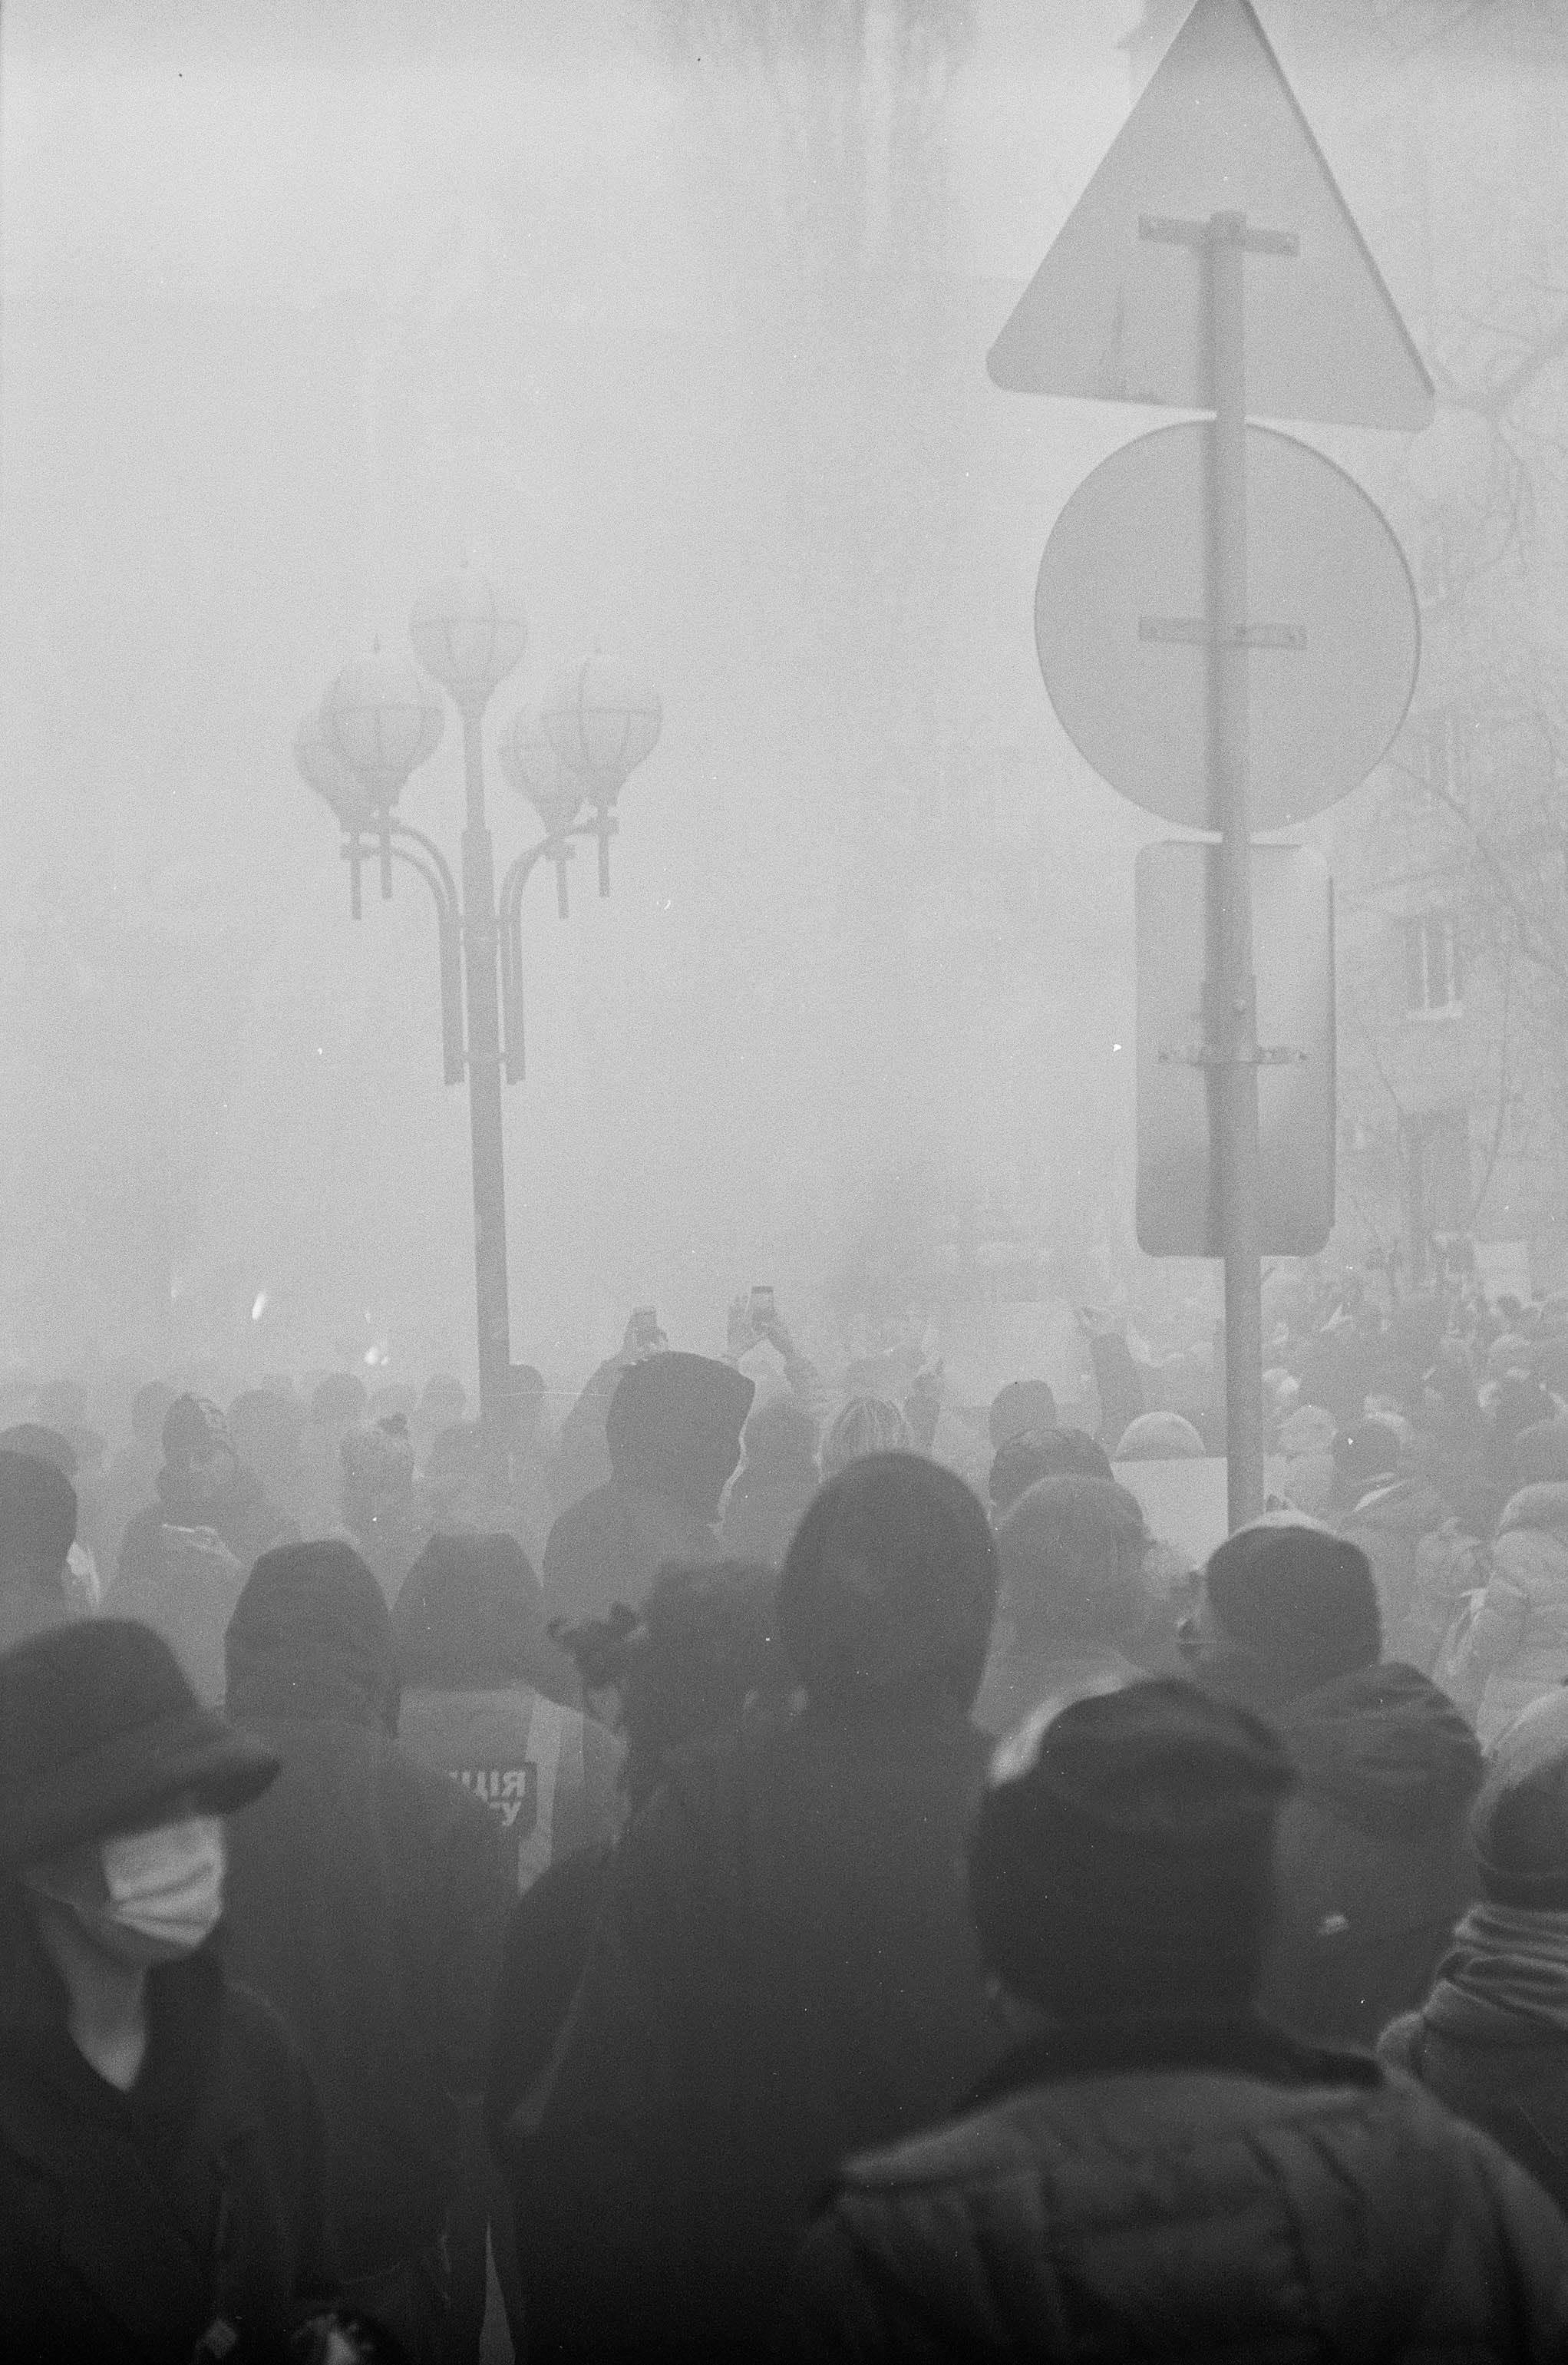
Fast forward a century: smoke in Pittsburgh, Pennsylvania from fossil fuels in the steel industry caked on peoples' clothes. Down south, Louisiana's Cancer Alley has proliferated since WWII, causing record numbers of cancer, asthma, and birth defects among the population.
THe costs in 2016: air pollution from the oil and gas sector in the US resulted in 410000 asthma exacerbations, 2200 new cases of childhood asthma and 7500 excess deaths, with $77 billion in total health impacts. (Environmental Research: Health, Volume 1, Number 2)

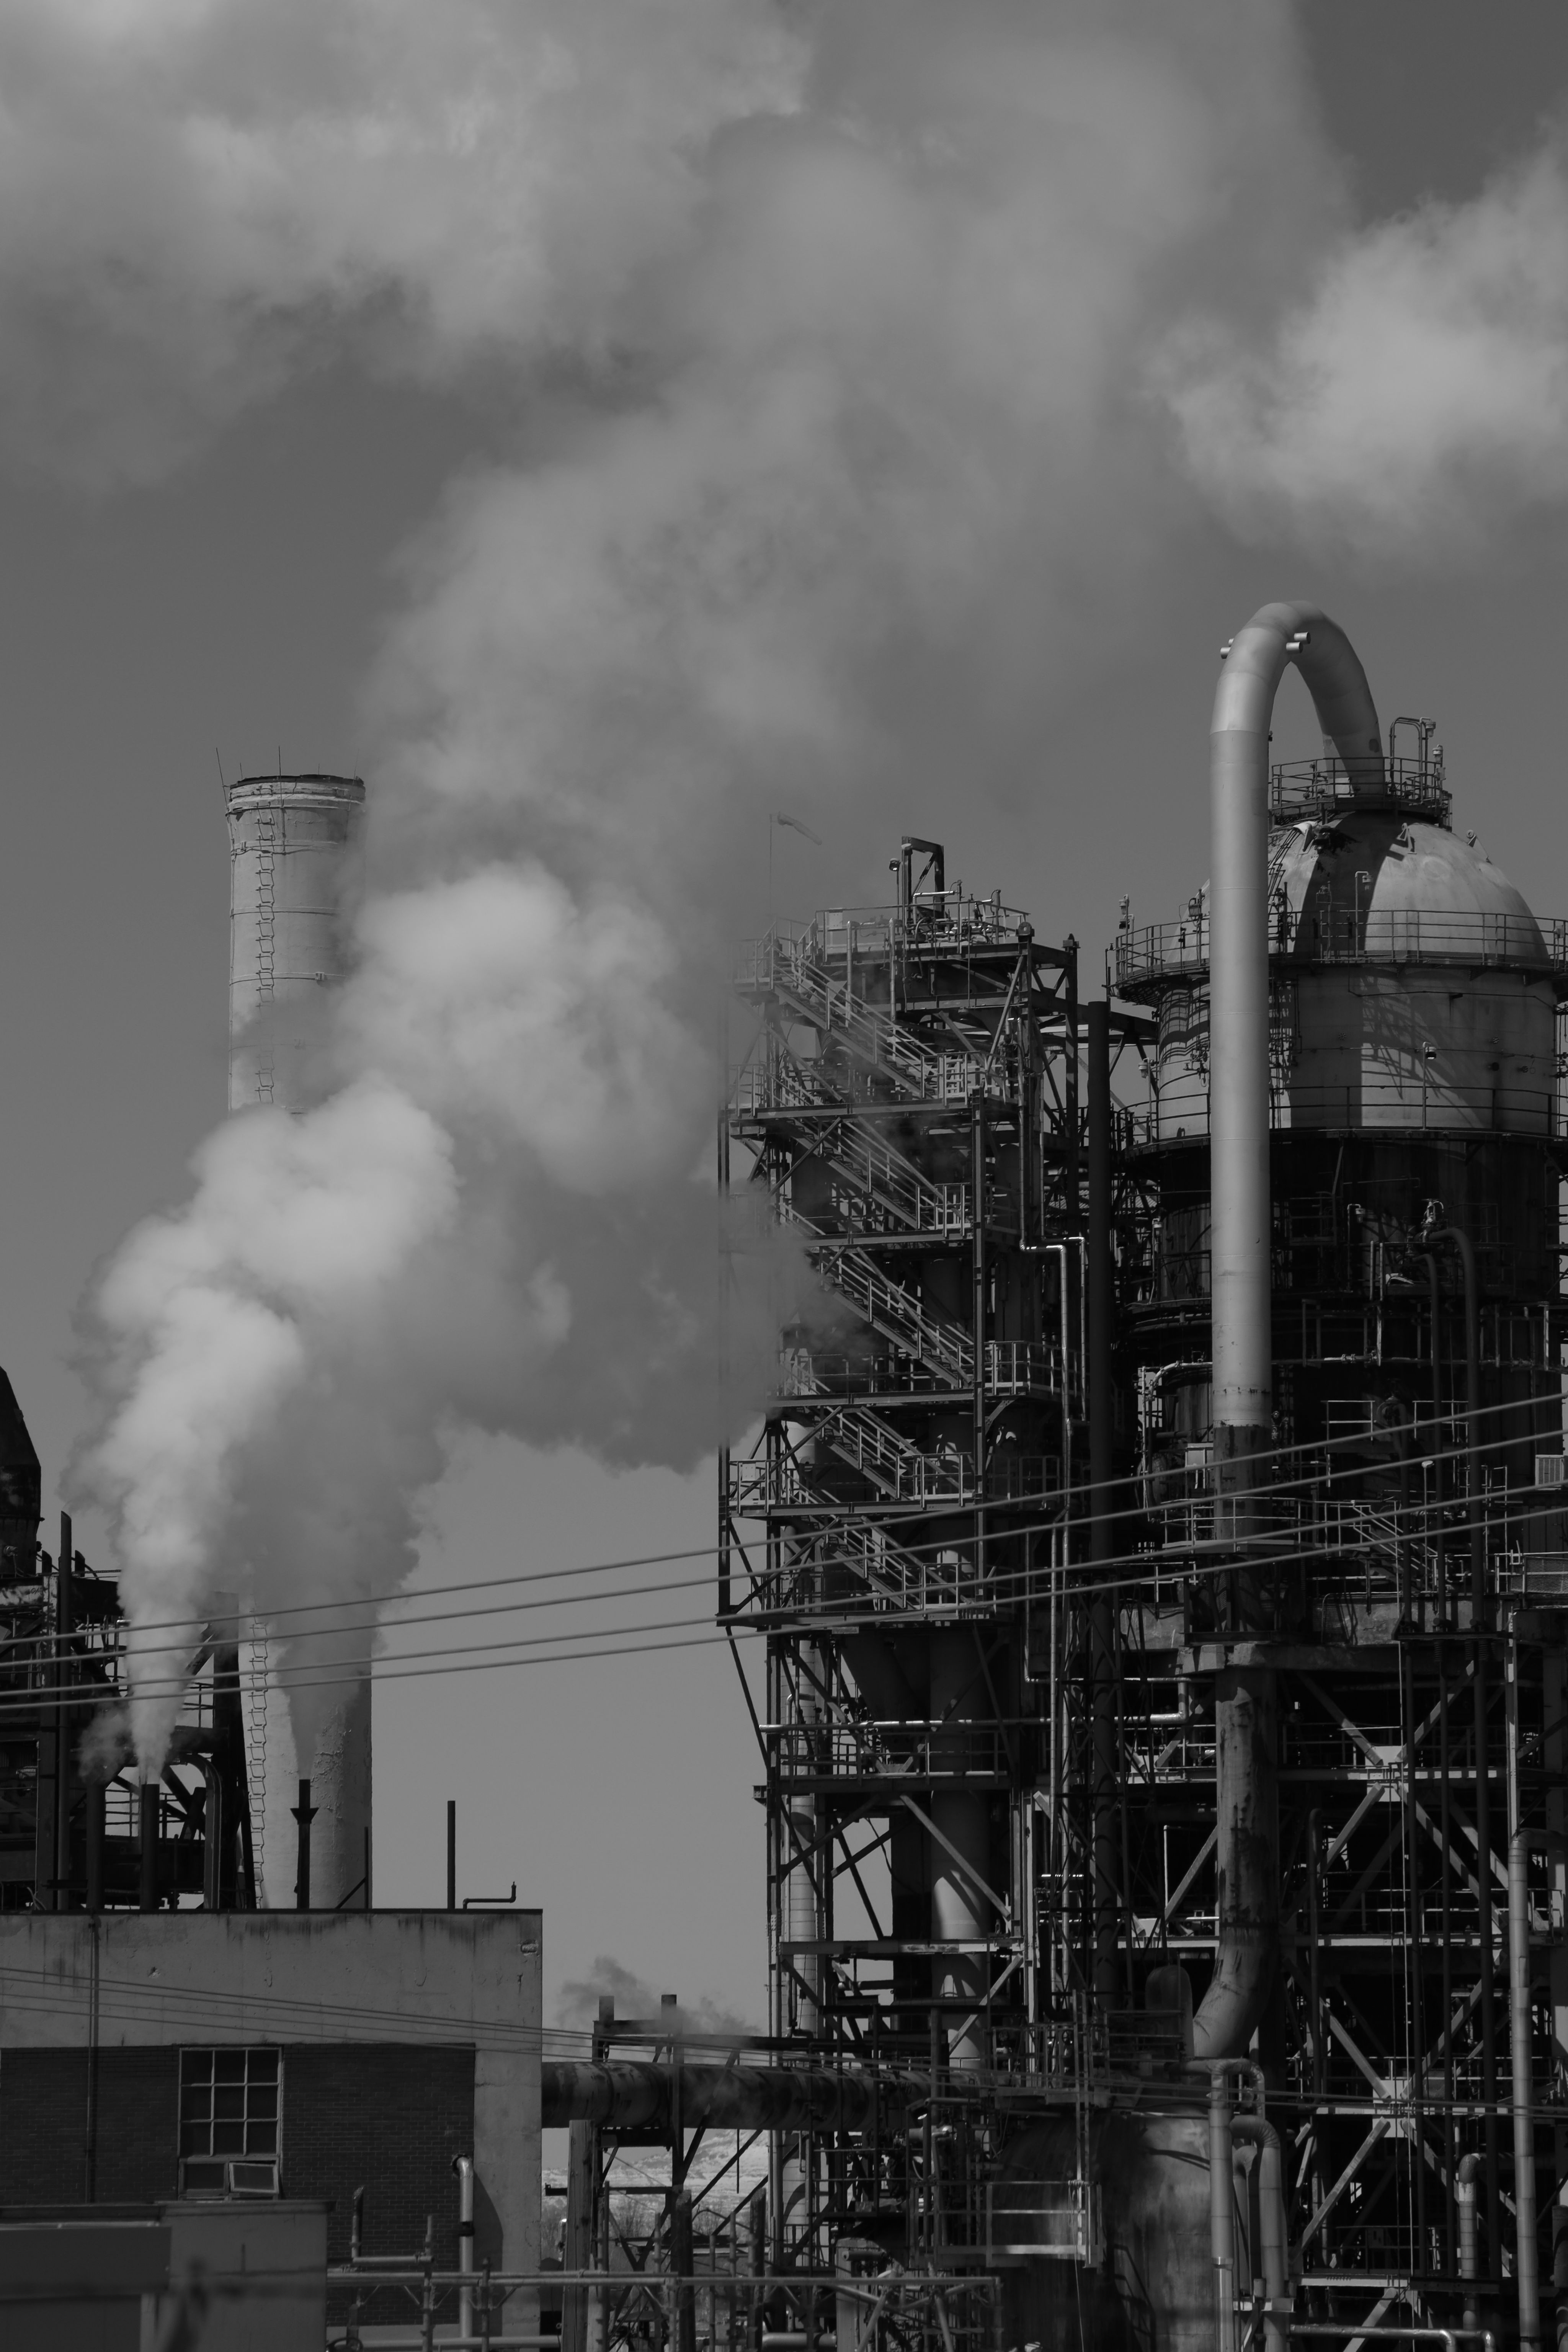
Photo by Danny Burke on Unsplash
Photo by Danny Burke on Unsplash


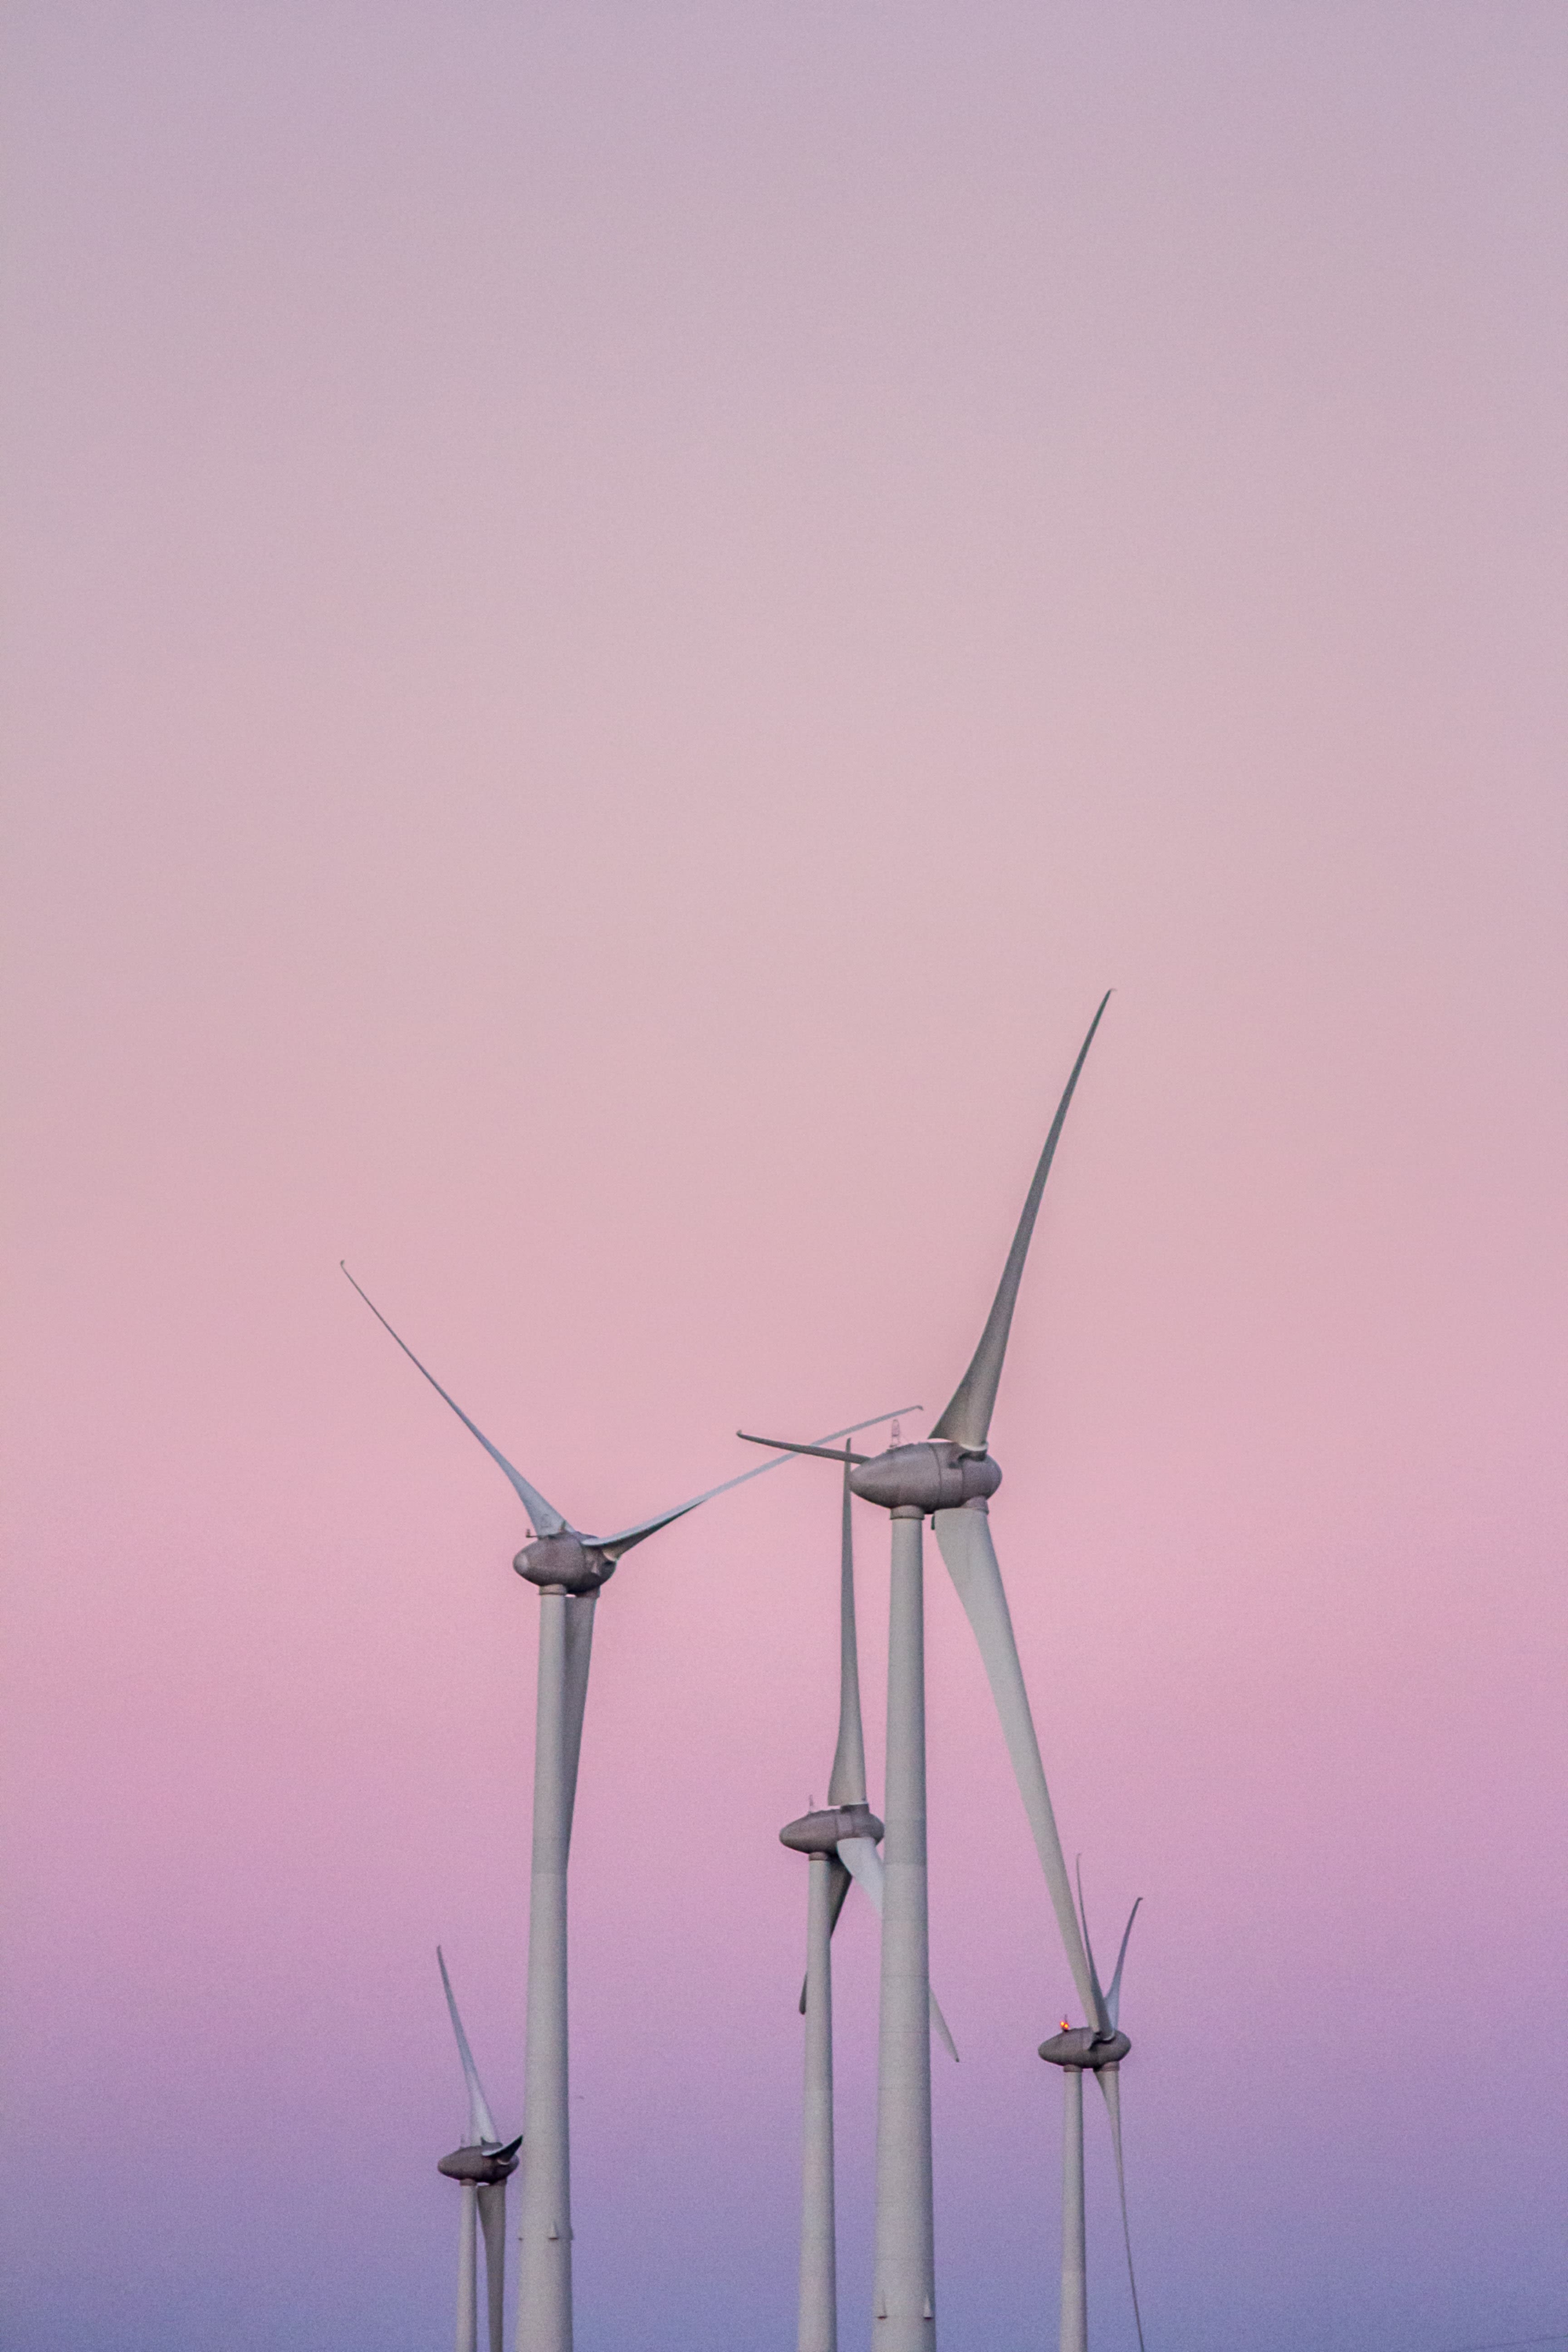
Luckily, our energy mix is not in stasis. In fact, we see some shifts...


The United States: Sweeping View
Consumption in the U.S. From 2001-2024 Still Overwhelmingly Powered By Fossil Fuels...
To interact with the visualization: click on the forward arrow to play the animation. To move the map around to view Alaska and Hawaii, hover over the map until you see a pop-up on the lefthand side below the Title. Click the arrow, then click the "Pan" option. You can also isolate fuel source's growth through clicking on the Fuel Source legend options.
In the early 2000s, another energy crisis loomed over the United States. President Bush recognized, for geopolitical and availability reasons, that the United States should move away from fossil fuels. Framed in a progressive lens, citing rising greenhouse gases, the public accepted this reality. However, in a twist of fate, the Marcellus Shale Revolution in Pennsylvania caused natural gas fracking activity to boom. Through a new reservoir, and enhanced fracking techniques, the United States seemingly reversed course on their transition.
...But the energy mix is more diverse
While fossil fuels remain the dominant fuel source in both consumption and generation, the decrease in coal can be explained by the Marcellus Shale Revolution. In fact: we can see that Coal and Natural Gas have effectively switched places in the most dominant energy source.
Lags in solar generation can be explained by costs, material availability, and complications in grid infrastructure. Implementing wind farms in the United States face similar challenges, and have notably been rejected by local stakeholders due to concerns of unsightly wind farms, as well as regulatory red tape.
Common misconceptions still cloud the real story.

Texas: A case study
To interact with the visualization: click on the forward arrow to play the animation. To move the map around to view Alaska and Hawaii, hover over the map until you see a pop-up on the lefthand side below the Title. Click the arrow, then click the "Pan" option.
Partisan debates have clouded discussions regarding energy across the United States, but shockingly, Texas is seen as a bright spot in renewable energy generation and consumption, as favorable regulations in the state have meant more capacity to invest in clean energy infrastructure. If more states can replicate this regulation landscape, we may see more gains across the board in states that have not enjoyed as much success, like California.
To interact with this visualization, hover over either the gray or yellow line to display state, year, and capacity.
Research cites a key difference between California and Texas lies in the permitting environment in each respective state. Texas does not require a formal process in the approval of energy infrastructure projects because the venture is considered private property. As a result, there is little community input-- or pushback-- involved in the approvals process for wind farms.
There's a light at the end of the tunnel!


Scroll down with the grey slider on the right of the pie charts to see more states.
Even still, considering challenges in permitting and other regulatory red tape, we can see gains across the United States related to increased renewable generation and consumption. States previously entrenched in fracking and oil wells have improved their energy mix perhaps due to the 2022 Inflation Reduction Act and Bipartisan Infrastructure Law. These policy measures involved tax credits, abatements, and grants for energy infrastructure across the board, but emphasized clean energy projects.
The power is in our hands
The transition to renewables is not a pie in the sky idea: it's already underway. Clean energy is a non-partisan topic that impacts all end users. To mirror the successes in building clean energy infrastructure that we've seen in Texas, we should move to replicate the regulatory landscape in other states to incentivize more clean energy projects without the headaches of excessive red tape. If policymakers are able to make this switch, then end users across the United States will be able to enjoy cheaper utility rates, job creation, and reap the benefits of less polluted air!
In 2022: Wind farm projects brought an additional $20B to the United States' economy.
Still feeling overwhelmed by the regulation red tape? Here are some alternatives that you can engage with to reduce pollution and fight climate change:
- Reduce consumption of red meat
- Compost food waste
- Reduce plastic use
- Support local farmers
- Bike or walk your commute


Sources
Council on Foreign Relations. “Timeline: Oil Dependence and U.S. Foreign Policy.” Accessed December 1, 2025. https://www.cfr.org/timeline/oil-dependence-and-us-foreign-policy
Human Rights Watch. “US: Louisiana’s ‘Cancer Alley.’” Human Rights Watch, January 25, 2024. Accessed November 21, 2025. https://www.hrw.org/news/2024/01/25/us-louisianas-cancer-alley
Cody Buonocore et al., “Air Pollution and Health Impacts of Oil & Gas Production in the United States,” Environmental Research: Health (2023), https://doi.org/10.1088/2752-5309/acc886
The White House. “Fact Sheet: Diversifying Our Energy Supply and Confronting Climate Change,” December 15, 2008. https://georgewbush-whitehouse.archives.gov/news/releases/2008/12/20081215-7.html
Brown, Stephen P.A., and Mine K. Yucel. The Shale Gas and Tight Oil Boom: U.S. States’ Economic Gains and Vulnerabilities. Council on Foreign Relations Report, October 2013. https://www.cfr.org/report/shale-gas-and-tight-oil-boom
Interesting Engineering. “Solar power’s uphill battle: Barriers to adoption in the shift to clean energy.” Interesting Engineering, November 1, 2024. https://interestingengineering.com/energy/challenges-of-solar-power
U.S. Department of Energy. “Advantages and Challenges of Wind Energy.” Last modified 2024 (or most recent). https://www.energy.gov/eere/wind/advantages-and-challenges-wind-energy
Utility Dive. “Texas is winning the energy war by ignoring the politics.” Utility Dive, November 20, 2025. https://www.utilitydive.com/news/texas-is-winning-the-energy-war-by-ignoring-the-politics/805887
Kleinman Center for Energy Policy. “Comparing Renewable Energy in California and Texas.” Blog post by Charlotte Scott, September 17, 2025. https://kleinmanenergy.upenn.edu/commentary/blog/comparing-renewable-energy-in-california-and-texas/
World Resources Institute. “Resources for Accessing IRA Clean Energy Tax Credits (IRA Elective Pay Implementation).” Accessed December 4, 2025. https://www.wri.org/initiatives/ira-elective-pay-implementation
United Nations. “Renewable energy – powering a safer and prosperous future.” Accessed December 4, 2025. https://www.un.org/en/climatechange/raising-ambition/renewable-energy
U.S. Department of Energy, “Land-Based Wind Market Report: 2022 Edition,” August 16, 2022. https://www.energy.gov/eere/wind/articles/land-based-wind-market-report-2022-edition