

You relocate to a new city.
Your car is the same.
Your driving record is the same.
Your habits behind the wheel haven't changed.
Your insurance coverage hasn't changed much.
Yet, your auto insurance premium CHANGES when you relocate.
For millions of Americans, a change in zip code, sometimes just a few miles, can mean hundreds of dollars more or less per year in insurance costs.
Then, HOW is insurance supposed to WORK?


How Auto Insurance Works?
Auto insurance, at its simplest, is about pricing risk.
When you apply for coverage, insurers evaluate a range of personal and geographic factors to estimate how likely you are to file a claim, and how costly that claim might be.
Risk factors include, but are not limited to:
- Driving history: prior accidents, traffic violations
- Driver profile: age, gender, years holding a license
- Vehicle type: make, model, year, and average repair/ replacement cost
- Annual mileage: the more you drive, the greater you exposure to risk
- Location: your state, city, and zip code
Drivers pay monthly premiums into a shared pool, and that money is used to cover claims when accidents happen.
If insurers expect more or costlier claims in the given area, premiums go up ↗.
If the risk is lower, prices tend to come down ↙.
So in theory, where you live should say something real about how much risk you face on the road.
But is that really true?
To keep the scope measurable, we look at measurable forms of road risk available:
Risk Factor
&
Average insurance premium
If premiums really reflect the area risk, places with a higher risk of accidents should carry higher insurance costs, as states with safer roads should cost less to insure.
Fatalities & Claim Risk Data


If roads are dangerous, premiums should reflect that, as they have a higher risk
This map shows the fatal rate per 100 million vehicle miles in 2022
South Carolina
Estimated population: 5,288,957
Total fatal: 1,094
Average fatal per 100M vehicle miles: 1.85
Average fatal per 10,000 population: 6.01
Mississippi
Estimated population: 2,918,371
Total fatal: 703
Average fatal per 100M vehicle miles: 1.76
Average fatal per 10,000 population: 7.44
New Mexico
Estimated population: 2,091,334
Total fatal: 466
Average fatal per 100M vehicle miles: 1.74
Average fatal per 10,000 population: 6.22
But fatal crashes, as devastating as they are, represent only a fraction of what insurers actually see, as fatal crashes are rare.
What insurers watch far more closely is the everyday reality of claims, like collisions and injury cases, that quietly add up across millions of drivers, every single day.
Data Source: National Association of Insurance Commissioners (NAIC) 1, 2, National Highway Traffic Safety Administration (NHTSA) 3, U.S. Census 4
Click here for the interactive visualization
Now,
How do insurance providers actually quantify risk?
The metric here is Risk Factor, which equals
how often accidents happen × how much each accident costs ($)
A state ranks higher when drivers file more often AND those claims cost more to settle.
High fatality rate doesn't equal high insurer risk.
Insurers aren't measuring mortality; they're measuring claim frequency × cost. A state can be deadly but still rank low here.
Data Source: National Association of Insurance Commissioners (NAIC) 1, 2
Click here for the interactive visualization
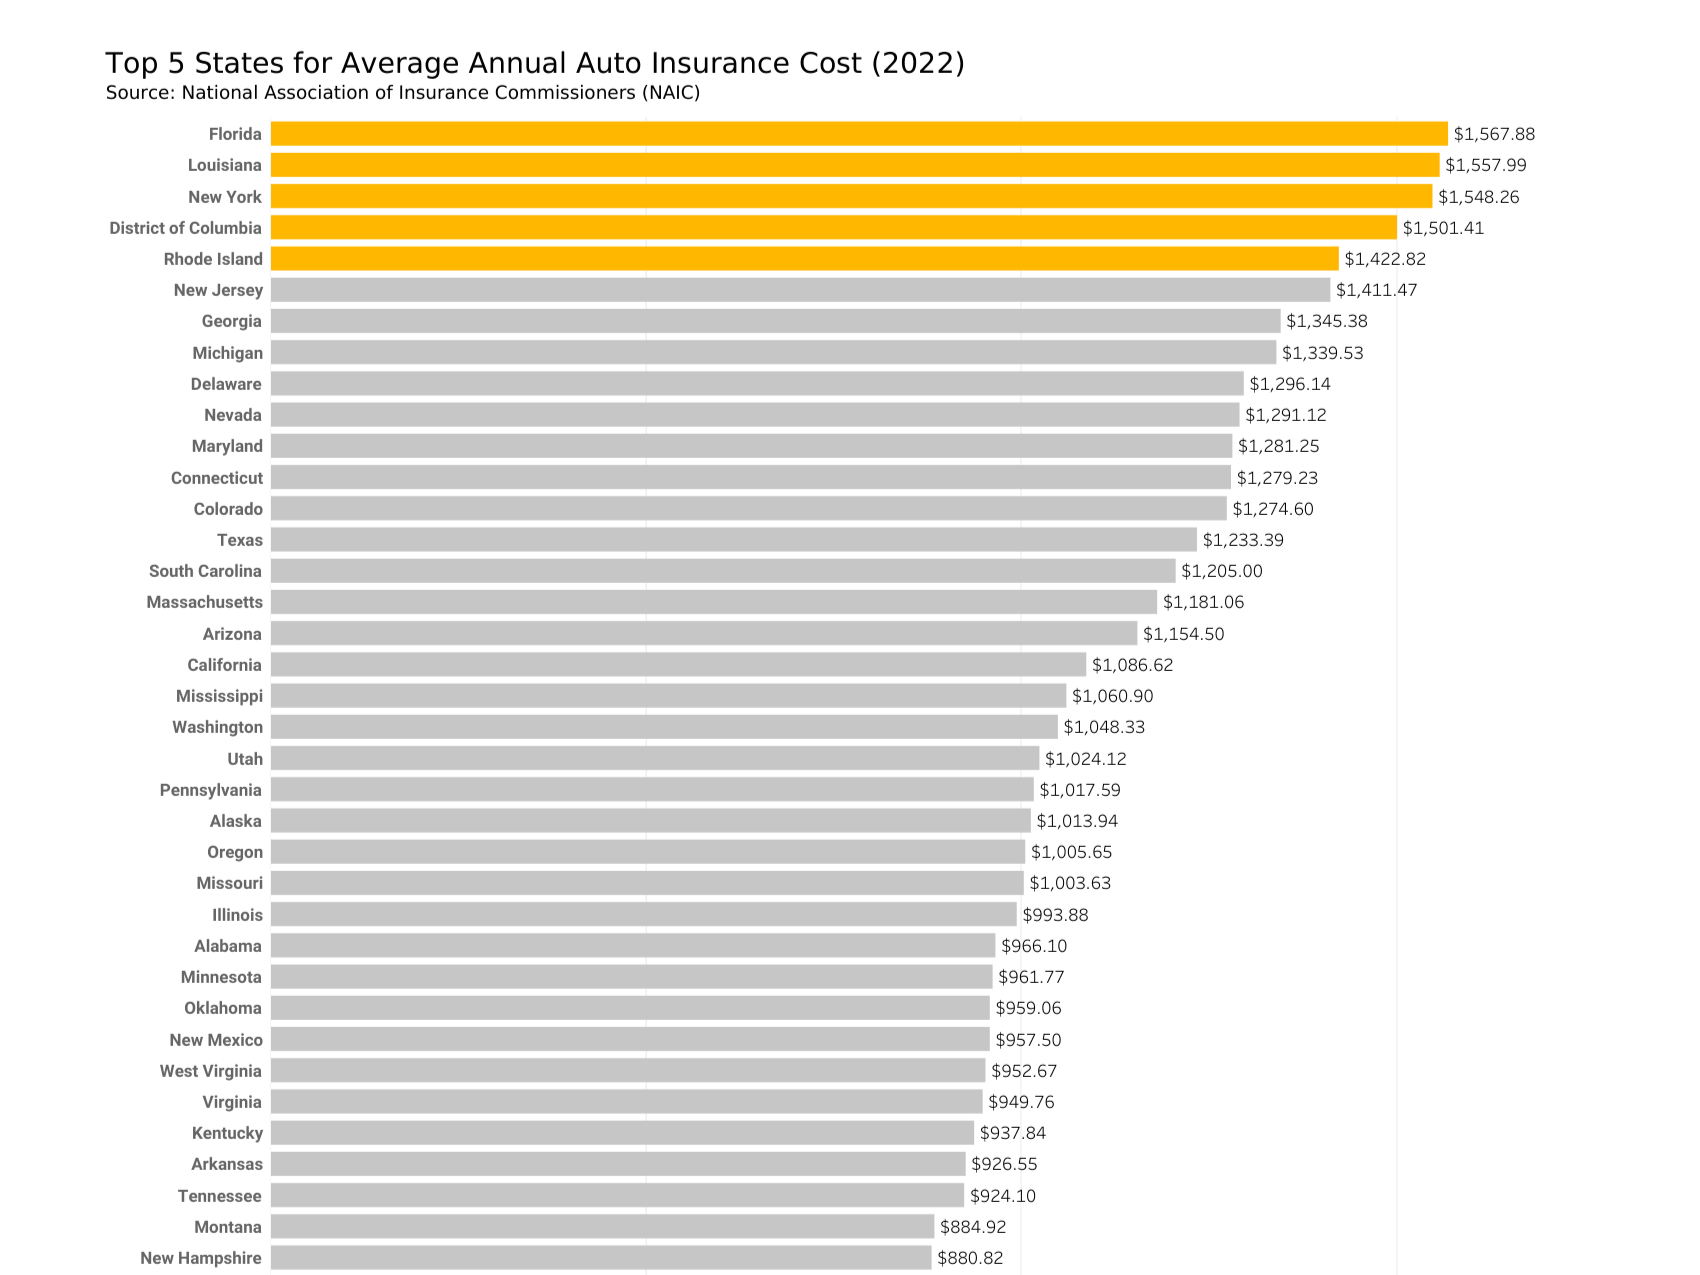
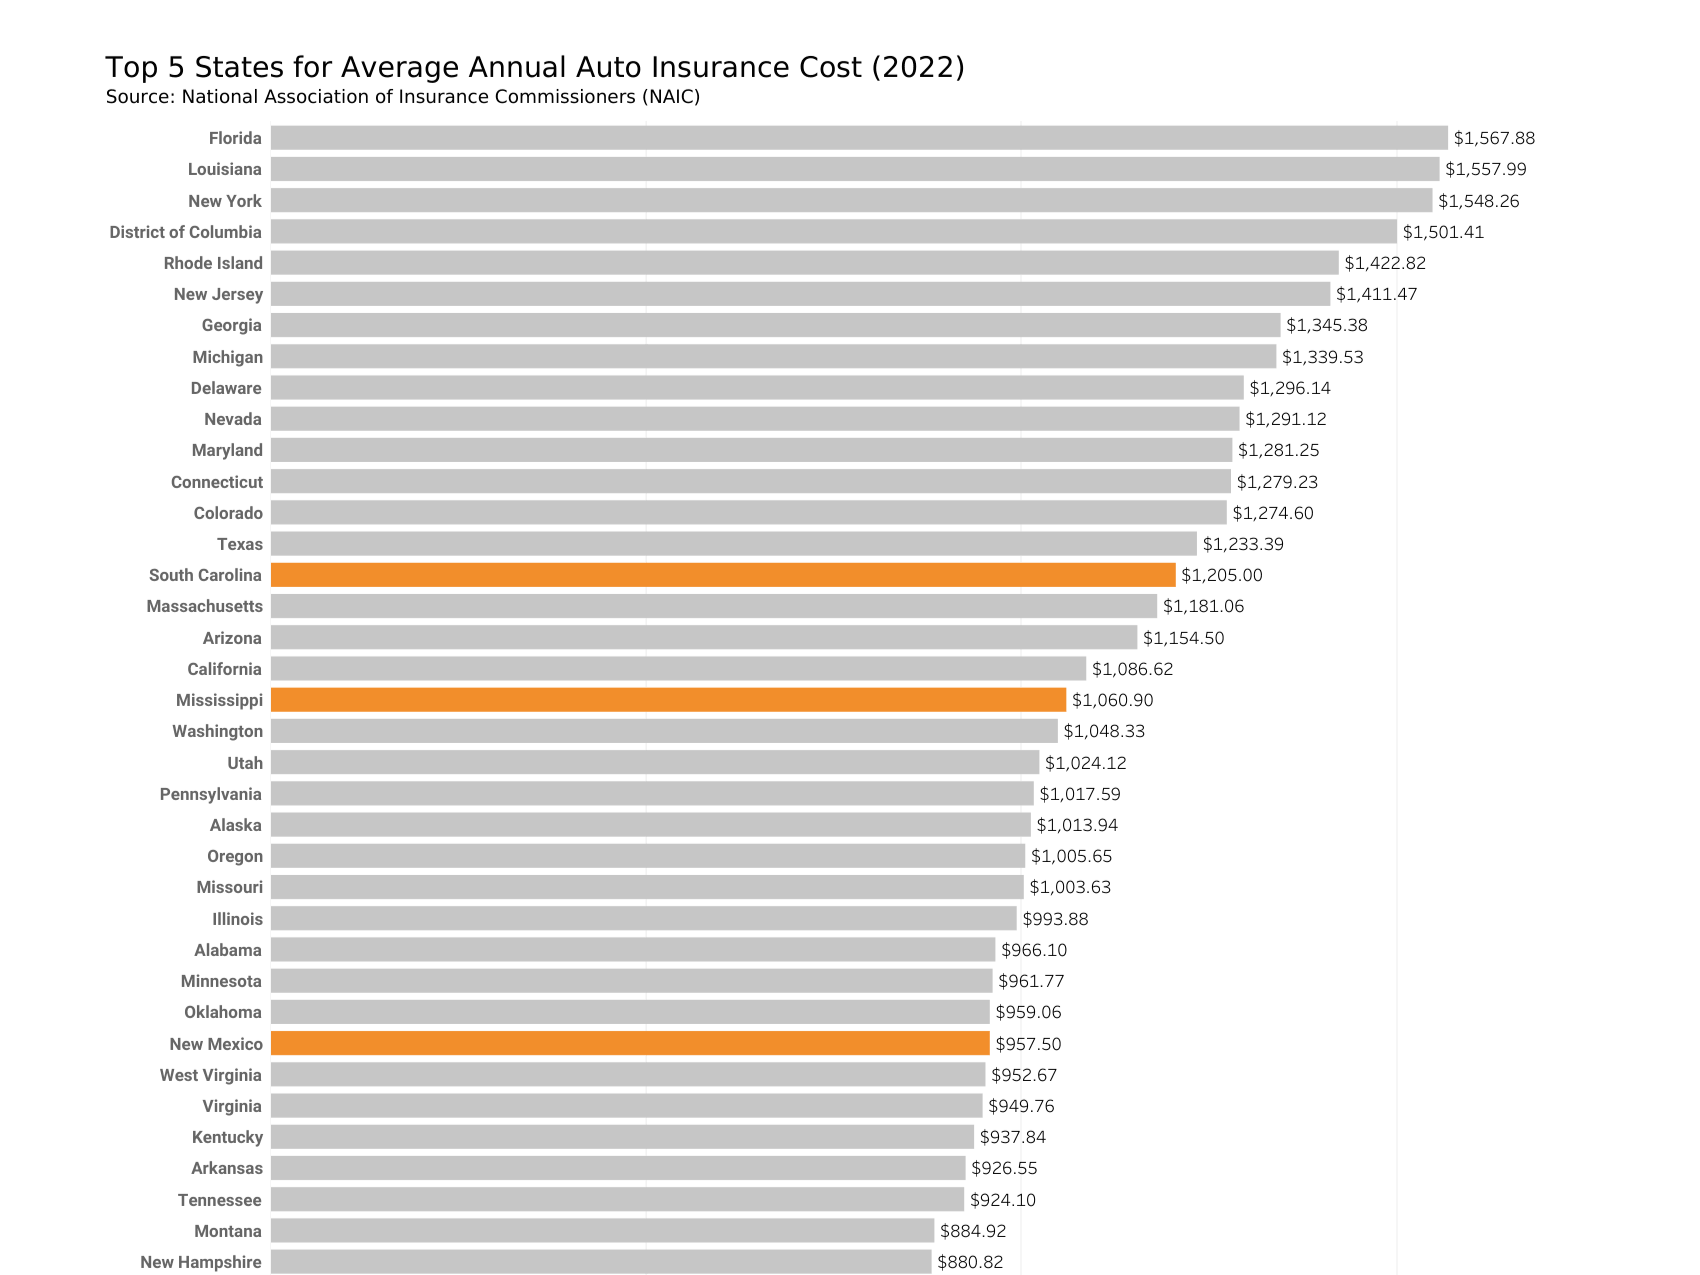
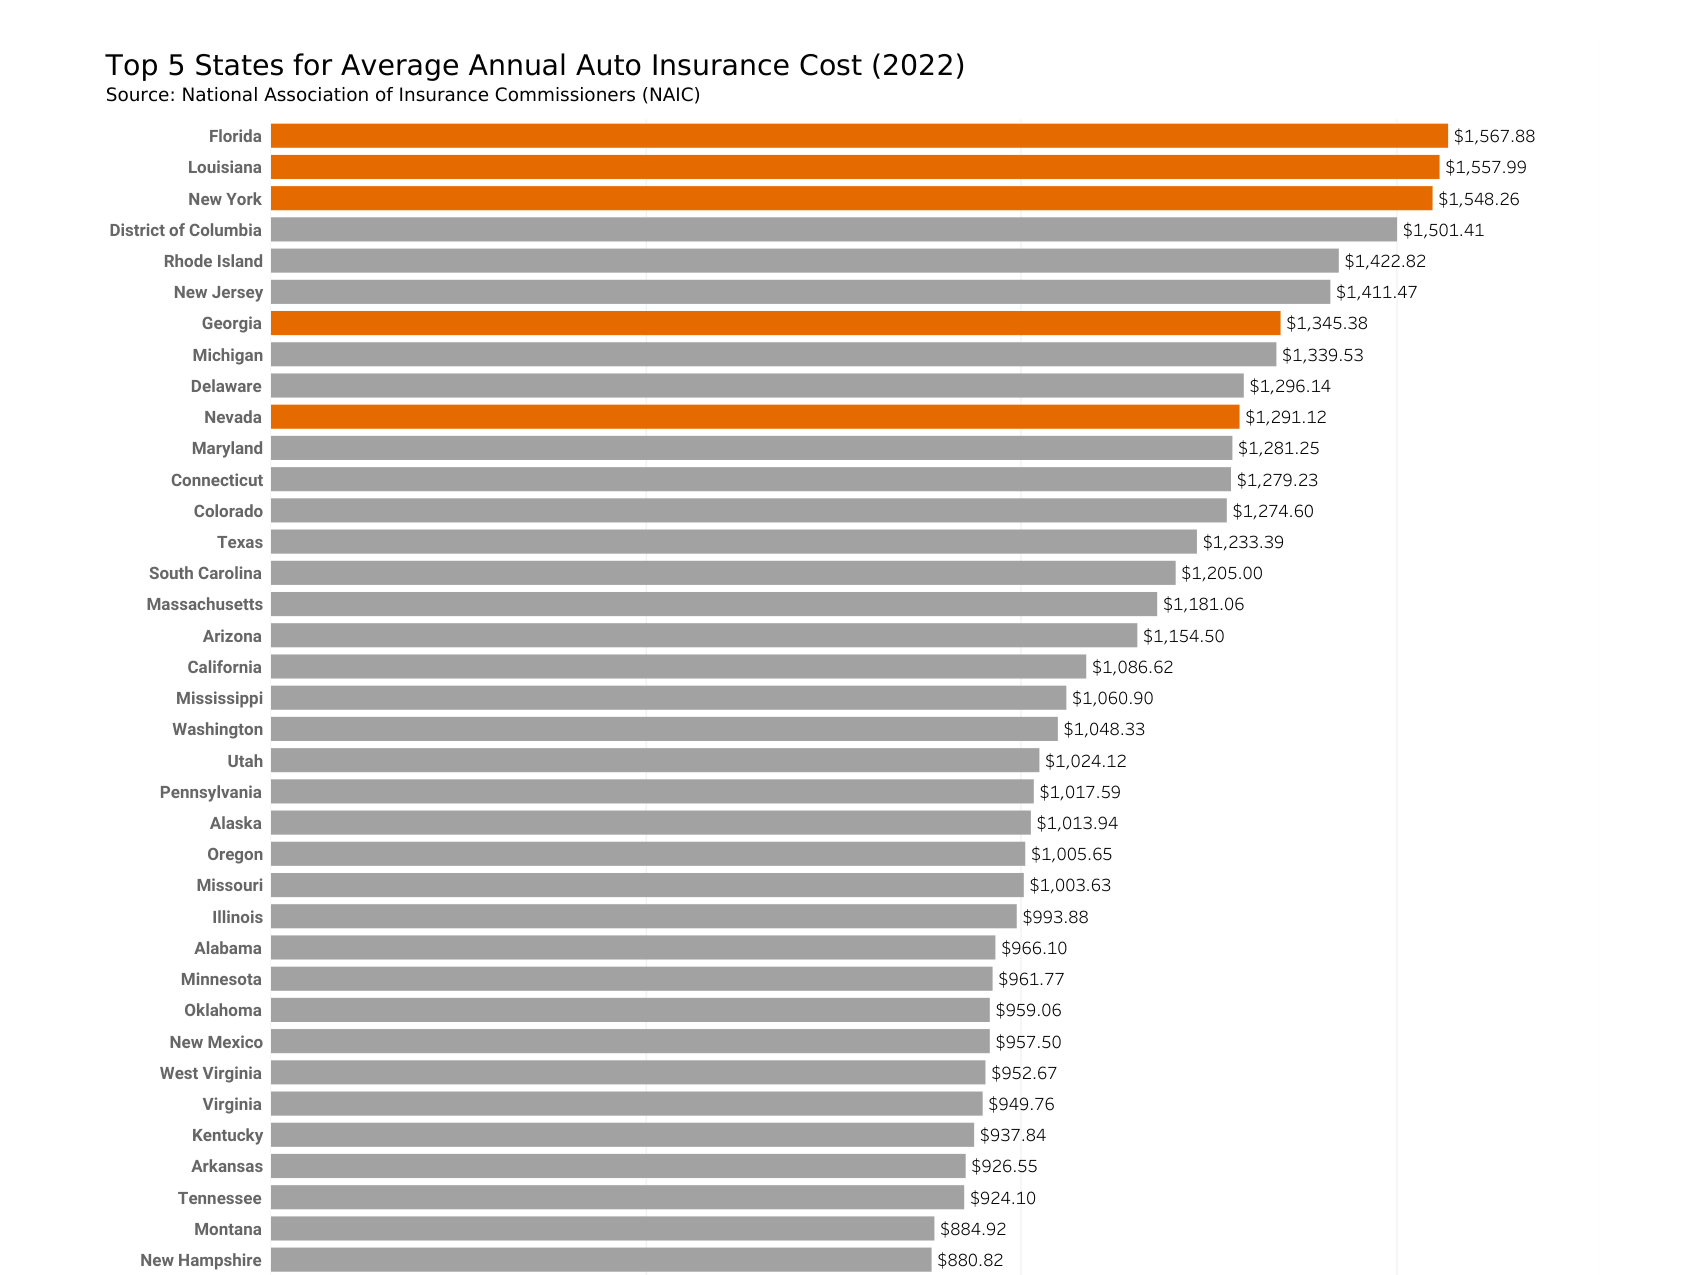
Average Auto Insurance Premium Data


This chart shows the average annual auto insurance premium per consumer in a state.
In our previous fatal rate analysis, we found South Carolina, Mississippi, and New Mexico have the highest fatal rate per 100M miles driven.
However, this chart shows that the fatality rate does not drive up premium costs.
Compared to the previous chart on claim risk, those same five states don’t rank in the top five here, but they still have relatively high average auto insurance premiums.
Does that mean
High Risk = High premium ($)?

Data Source: National Association of Insurance Commissioners (NAIC) 1, 2
Click here for the interactive visualization
Let's see if there is a relationship between
Premium vs. Risk
This shows the relationship between the premium cost per consumer and the risk factor (claim frequency × claim amount).
The highest two premium costs show high risk.
South Carolina, which we saw earlier with the highest fatal rate, does not necessarily mean it has higher accident frequency or average claim amount.
Michigan’s auto insurance is expensive despite relatively low accident risk, largely because of its no-fault insurance system, which means insurance has to cover all costs for anyone, regardless of who caused it, significantly increasing claim costs and premiums.
The chart shows a clear positive linear relationship: as the risk factor (driven by accident frequency and claim cost) increases, average auto insurance premiums rise accordingly.
In other words, insurance providers charge higher premiums in higher-risk states to offset the greater expected cost of claims.
Data Source: National Association of Insurance Commissioners (NAIC) 1, 2
Click here for the interactive visualization
What does this mean for you?
Your auto insurance premium isn't random.
It reflects the real cost of accidents in your state.
Moving to a new state?
Check where it ranks on the risk scale. A state with lower premiums isn't always cheaper to insure in. It may simply have fewer accidents. Knowing the difference helps you budget smarter.
Curious about your current premium?
If your state sits low on the risk chart but your bill feels high, it may be worth shopping around or reviewing your coverage.
Your state's risk profile suggests you could be paying less.
Want to understand the bigger picture?
Insurance pricing is also shaped by state regulations, legal environments, and minimum coverage laws, which are outside of drivers' control.
Advocacy for transparent rate-setting starts with knowing what's driving the number on your bill.
Reference
1 National Association of Insurance Commissioners (NAIC). (2025, December). 2022/2023 Auto Insurance Database Report. https://content.naic.org/publications
2 National Association of Insurance Commissioners (NAIC). (2025, June). 2023 Auto Insurance Database Average Premium Supplement. https://content.naic.org/publications
3 National Highway Traffic Safety Administration (NHTSA). (2022). Fatality Analysis Reporting System (FARS) 2022 Annual Report File. https://www.nhtsa.gov/research-data/fatality-analysis-reporting-system-fars
4 U.S. Census Bureau. (2025). County Population Totals and Components of Change: 2020–2025. https://www.census.gov/data/datasets/time-series/demo/popest/2020s-counties-total.html