Is Food affordable today for everyone?

Introduction
In an era of soaring global food prices, this article offers a comprehensive analysis of the alarming increase in the cost of essential sustenance over the past few years. Through meticulous research and data exploration, we delve into the intricate dynamics surrounding food expenses per person and the Consumer Price Index (CPI), unveiling the disconcerting reality faced by individuals worldwide.
Our investigation meticulously examines the surge in prices for fundamental food items, exacerbating the challenge of maintaining a healthy diet for a substantial portion of the population. By scrutinizing data trends over the past three years, we highlight the stark reality that many countries face, where affordability becomes a barrier to securing a nutritious daily intake.
Amidst these troubling trends, we draw attention to the paradoxical issue of food wastage persisting concurrently with rising food prices and increased food insecurity. Despite the growing challenges in accessing nourishing meals, wasteful practices endure, raising critical questions about resource allocation and sustainable consumption.
Join us in unraveling the intricate web of factors contributing to the global conundrum of escalating food prices, food insecurity, and the paradox of wastage amid deprivation. Through a nuanced exploration of data and trends, this article seeks to foster a deeper understanding of the urgent need for comprehensive solutions to ensure food security for all in the face of mounting challenges.
Global Challenges Amplifying Food Prices
Global and domestic challenges continue to drive the escalation of food prices. Key factors contributing to this phenomenon include disruptions caused by the pandemic and the ongoing war in Ukraine. The pandemic significantly impacted the food supply chain, disrupting production, processing, and retail. Lockdowns resulted in a shift from restaurant to home consumption, affecting producers catering to restaurants and leading to increased demand at grocery stores. The subsequent challenges in adapting operations, labor turnover, contamination protection investments, and rising transportation costs all contributed to increased food production costs, which are reflected in the prices consumers pay for groceries.
The war in Ukraine further intensified the situation, as Russia and Ukraine, major wheat producers, faced challenges due to the conflict. Ukraine's decreased agricultural production and export capabilities resulted in a global wheat shortage, driving up the prices of key ingredients like flour and starch. The release of 20 million tons of grain from Black Sea ports offered temporary relief, but long-term complications persist, with estimates suggesting a substantial decline in Ukraine's grain harvest for the 2022-2023 period.
Additionally, sanctions imposed on Russia by Western countries, as a consequence of the war, have led to bans on Russian imports, including oil and gas. The resulting 23.8% rise in energy prices further compounds the challenges faced by the food industry. Soaring fertilizer costs, coupled with the pre-existing shortage, have significantly impacted farmers, forcing them to increase crop prices. With Russia being a major exporter of fertilizers, accounting for almost 30% of global exports, the sanctions have exacerbated the fertilizer shortage, contributing to the overall increase in food prices.
Embark us in navigating this vast expanse, where numbers and narratives converge to unveil the compelling story of our collective relationship with food—a narrative transcending borders and resonating with the shared human experience.

Food prices in world


Data viz link for tableau public: https://public.tableau.com/app/profile/krishna.biswal8398/viz/UnveilingGlobalFoodExpensesAFive-YearAnalysis2017-2021/Sheet1
The Surge in Food Prices
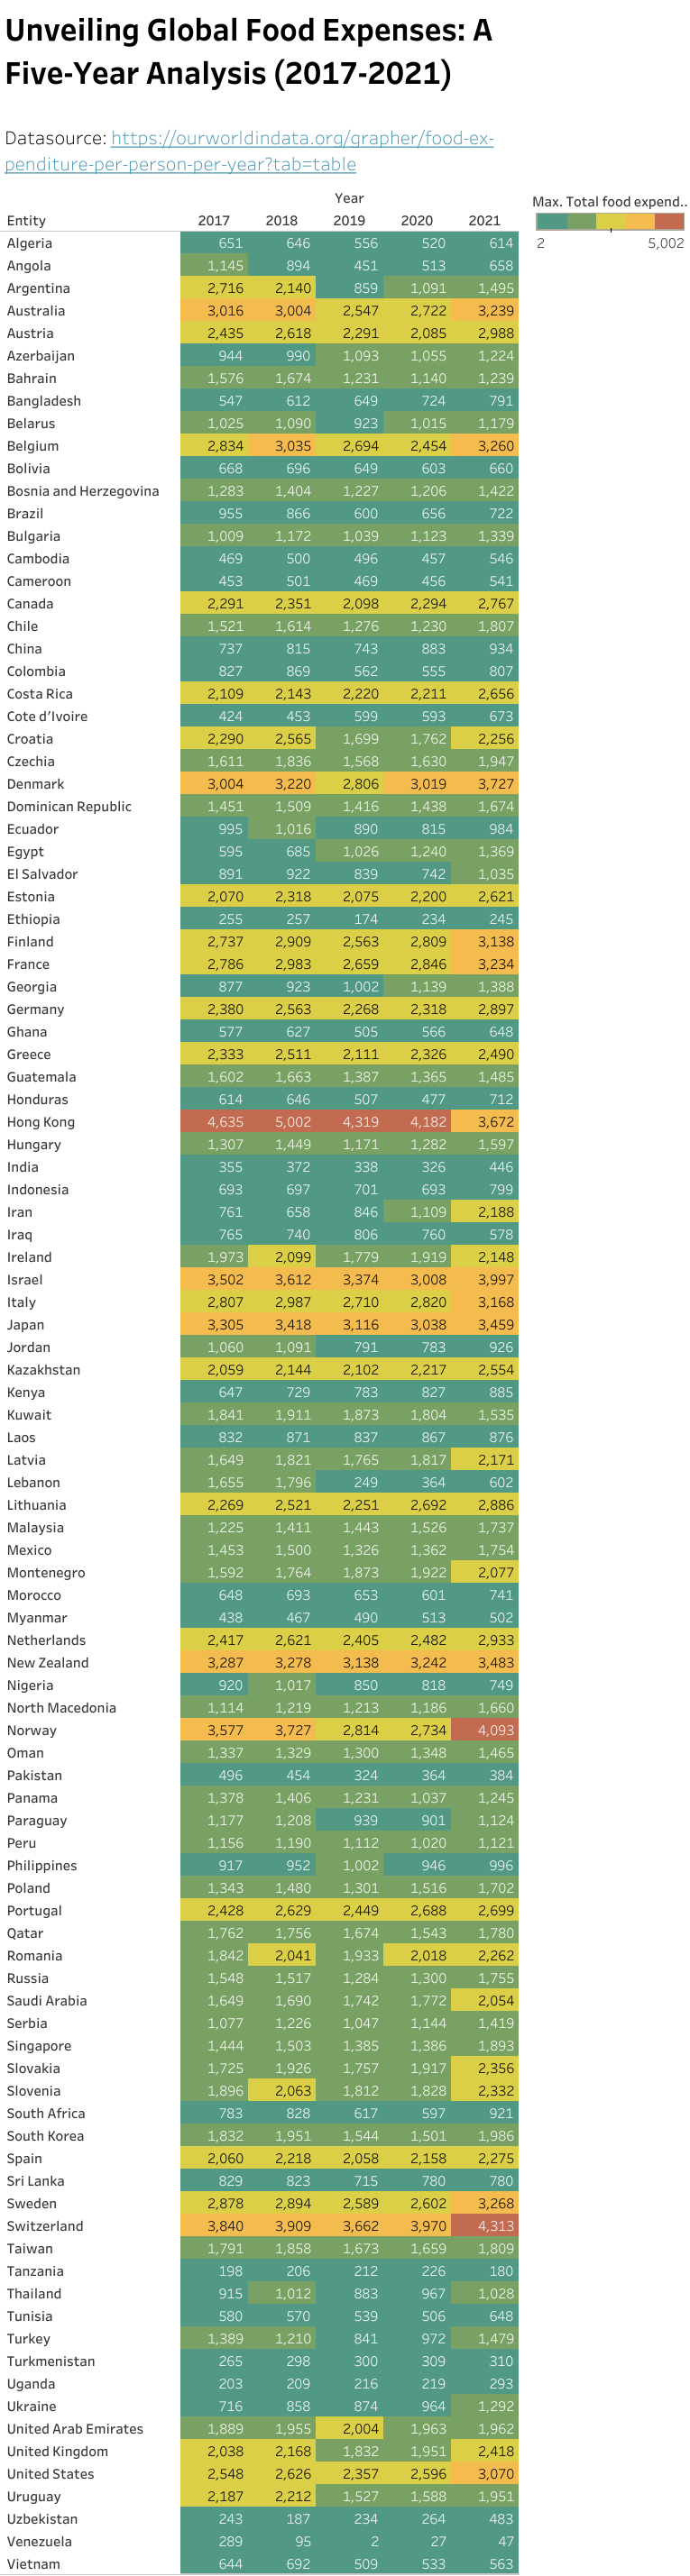
Within this graph, a five-year narrative unfolds, encompassing the years 2017 to 2021 and detailing per-person expenses for all countries. The numbers, expressing annual expenditure per individual, come to life through a vibrant color spectrum. Green hues mark the lowest expenses, while yellow represents a moderate range (greater than 2000 and less than 4000), and red signifies the highest expenditures (greater than 4000). This visually engaging approach provides a nuanced understanding of expense variations across the global landscape, turning data into a vivid portrayal of financial trends.

Data viz link: https://public.tableau.com/views/Pocket-PinchingNationsTheMostExpensiveCountriesof2019to2021WhereExpenditureSoarsBeyond3000PerPersonAnnually/Sheet12?:language=en-GB&:sid=&:display_count=n&:origin=viz_share_link
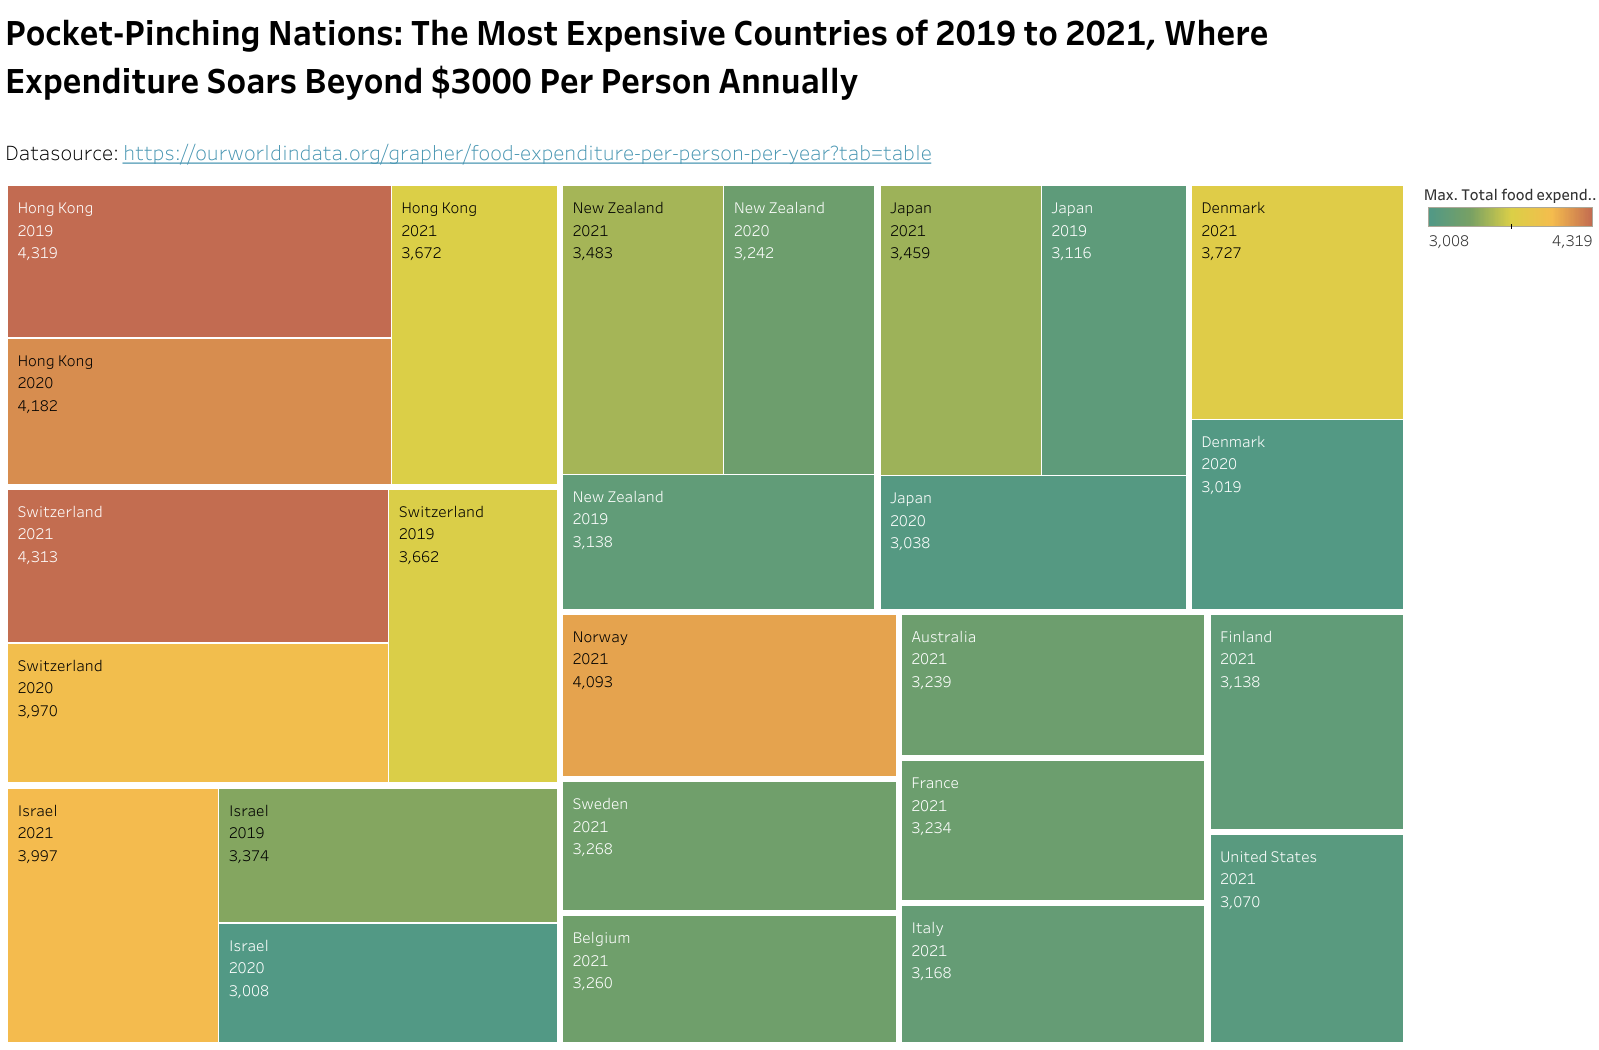
Over the past three years (2019 to 2021), a group of nations has stood out with annual per-person food expenses surpassing 3000. Hong Kong, Switzerland, and Norway lead the pack, exceeding an impressive 4000. Additionally, countries like New Zealand, Japan, Denmark, Netherlands, Finland, Sweden, and Israel, while not topping the list, have noteworthy per-person expenses above the 3000 threshold. This diverse set of nations provides insights into the varied factors influencing global food prices, from economic strength to regional policies. As we explore these countries, it becomes clear that understanding the nuanced interplay of factors is essential for addressing the challenges of rising food costs on a global scale.


Struggle for a Healthy Diet
As our exploration of global food landscapes delves deeper, a concerning revelation surfaces—a significant share of the global population in 49 countries faces the harsh reality of being unable to afford a healthy diet. In these nations, comprising more than 60% of their populations, the basic necessity of access to nutritious food remains unmet.
Uncovering the Scope of the Issue: Filtering through the data reveals a distressing truth—despite the abundance of food resources globally, a substantial portion of the population in these 49 countries grapples with the daily challenge of securing a balanced and healthy diet. The implications of this issue extend beyond mere statistics, delving into the lives and well-being of millions.
The Human Impact: Behind every percentage and data point lies a human story. Families are making sacrifices, individuals are facing compromised health, and communities are navigating the long-term consequences of inadequate nutrition. The visual representation of this data serves as a stark reminder that the pursuit of a healthy life is a privilege for many, not a given right.

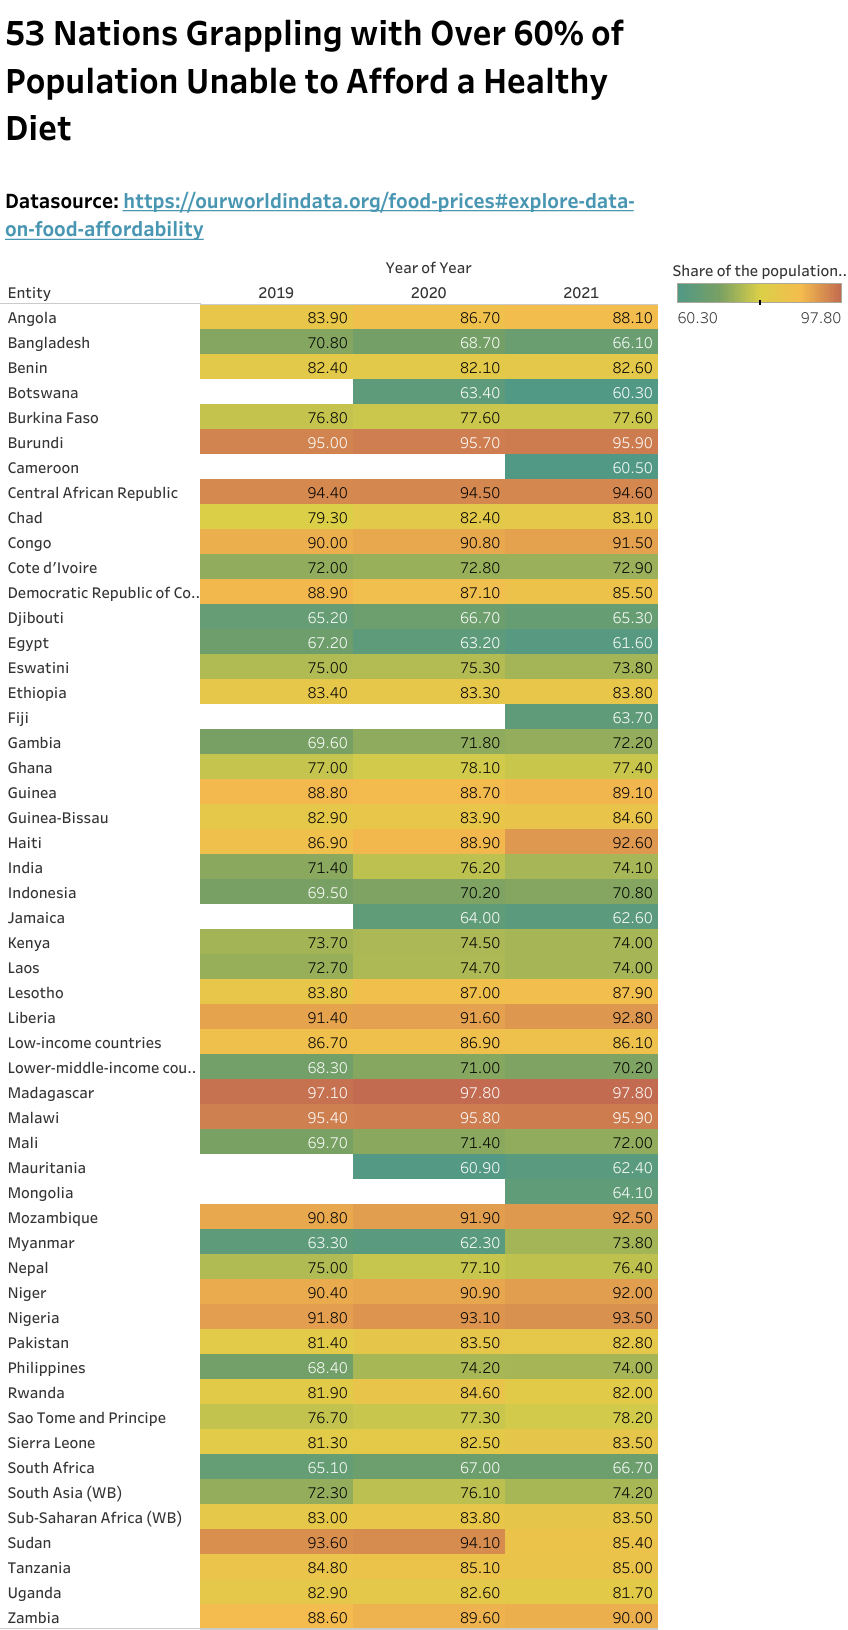
Data viz link: https://public.tableau.com/views/53NationsGrapplingwithOver60ofPopulationUnabletoAffordaHealthyDiet/Allcountriesdataonhealthydiet2019-2021?:language=en-GB&:sid=&:display_count=n&:origin=viz_share_link
In examining the data from 2019 to 2021, a stark reality emerges — certain countries grapple with a pervasive challenge: over 90% of their populations are unable to afford a healthy diet. This poignant revelation, depicted graphically, unveils the extent of the issue and prompts a deeper exploration into the economic and social factors contributing to this alarming disparity.

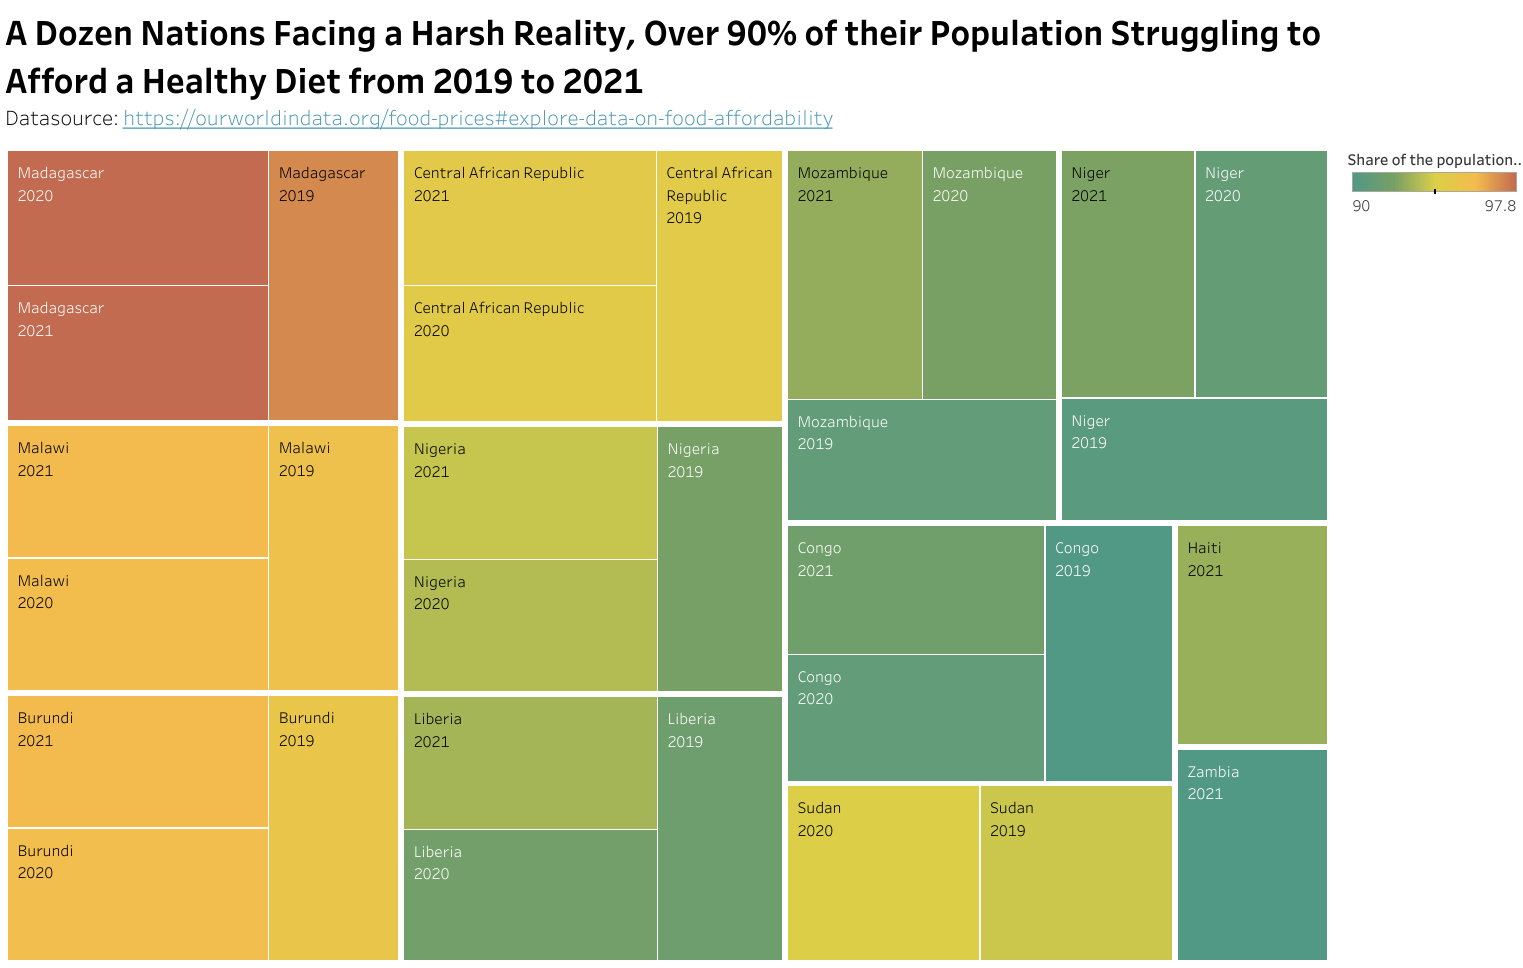
Data viz link: https://public.tableau.com/views/ADozenNationsFacingaHarshRealityOver90oftheirPopulationStrugglingtoAffordaHealthyDietfrom2019to2021/TopCountrieswhocouldnotaffordhealthydiet?:language=en-GB&:sid=&:display_count=n&:origin=viz_share_link


How is Pittsburgh doing with food price?
What is Customer Price Index and why is it important?
CPI stands for Consumer Price Index. It is a measure that examines the average change in prices paid by consumers for goods and services over time. The CPI is a crucial economic indicator used to assess inflation and reflect the cost-of-living changes. It tracks a predetermined basket of goods and services commonly purchased by households, including food, clothing, rent, healthcare, and more.
From the graph, it appears there has been a notable increase in the Consumer Price Index (CPI) for Pittsburgh between 1991 and 2000. In 1991, the CPI was recorded at 262, and by the year 2000, it had risen to 315. The subsequent years from 2010 to 2018 in Pittsburgh witnessed a further increase in the Consumer Price Index (CPI). In 2010, the CPI had risen to 443, and by 2018, it reached 518. This upward trend suggests an increase in the overall price levels of goods and services commonly consumed in Pittsburgh during that period. The CPI serves as a valuable indicator for assessing changes in the cost of living and inflation rates over time.
Reference: https://www.investopedia.com/terms/c/consumerpriceindex.asp#:~:text=The%20Consumer%20Price%20Index%20measures%20the%20overall%20change,followed%20by%20policymakers%2C%20financial%20markets%2C%20businesses%2C%20and%20consumers.

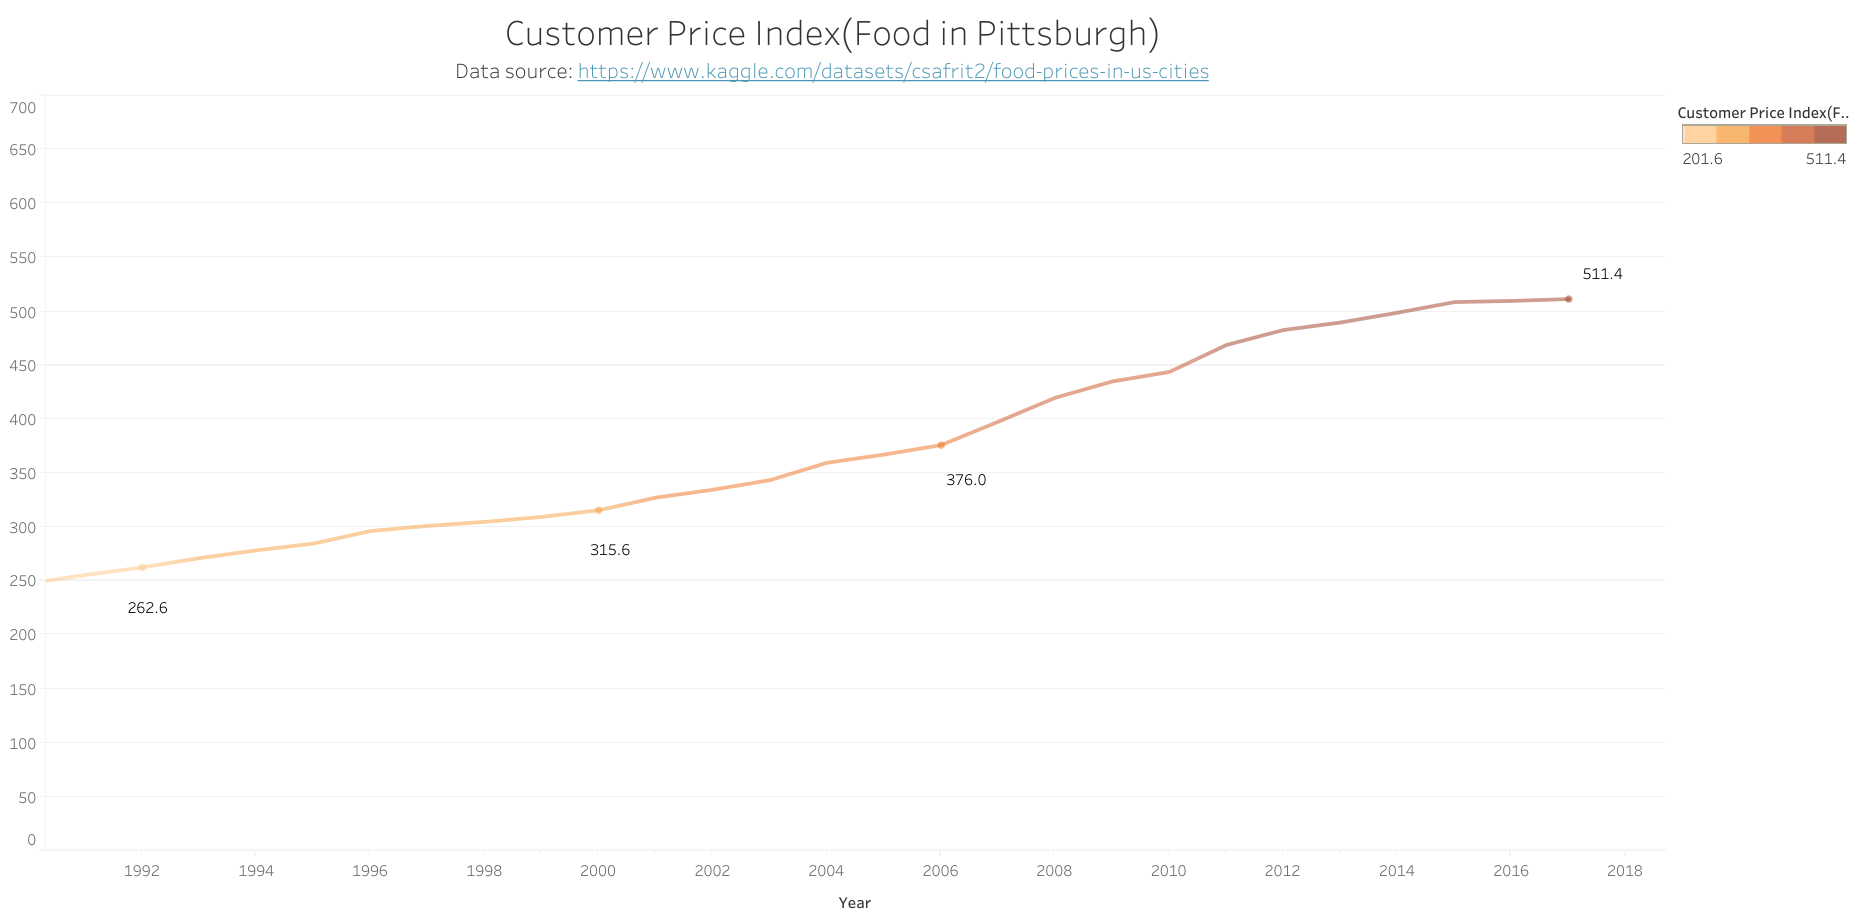
The Consumer Price Index (CPI) serves as a metric to gauge the average fluctuations in prices paid by urban consumers for a specified market basket of consumer goods and services. The graph vividly illustrates the discernible upward trajectory in prices over the years.
Data viz link: https://public.tableau.com/views/Customerpriceindex_pittsburgh/Sheet1?:language=en-GB&:sid=&:display_count=n&:origin=viz_share_link
Pittsburgh's Plate
A 27% Surge in Food Prices (2019-2024)
According to the U.S. Bureau of Labor Statistics, the cost of food has surged by 26.72% in 2024 compared to 2019, resulting in a substantial $5.34 difference. This data highlights a significant economic impact on food affordability over the five-year span. The average annual inflation rate for food between 2019 and 2024 stands at 4.85%, showcasing a consistent upward trend. To put it in perspective, a $20 purchase in 2019 would now cost $25.34 in 2024. Notably, this food inflation rate surpasses the overall inflation rate of 3.82% during the same period, emphasizing the unique challenges faced by the food sector. In 2019, food prices changed by 1.88%, surpassing the overall inflation rate of all items (1.81%) for that year. These details provide a comprehensive understanding of the intricate dynamics influencing food costs and their impact on inflation trends.
Reference: https://www.in2013dollars.com/Food/price-inflation/2019-to-2024?amount=20
In ensuring a nutritious and balanced diet, the cost analysis for various Western food items is essential, considering both daily and monthly requirements. Indicative prices include $0.29 for 0.25 liters of regular milk, $0.86 for a loaf of fresh white bread (125.00 g), $0.51 for 0.10 kg of white rice, $0.62 for two regular eggs, $1.36 for 0.10 kg of local cheese, $1.89 for 0.15 kg of chicken fillets, $2.09 for 0.15 kg of beef round (or equivalent back leg red meat), $2.09 for 0.30 kg of apples, $0.47 for 0.25 kg of bananas, $2.50 for 0.30 kg of oranges, $1.27 for 0.20 kg of tomatoes, $0.84 for 0.20 kg of potatoes, $0.51 for 0.10 kg of onions, and $0.57 for 0.20 head of lettuce. The daily recommended minimum expenditure for food per person is $15.87, while the monthly recommended minimum amounts to $492.03, considering a 31-day month. These figures offer a comprehensive overview of the financial considerations necessary to fulfill dietary requirements and sustain a healthy lifestyle.
Refrerence: https://www.numbeo.com/food-prices/in/Pittsburgh


The Paradox of Food wastage


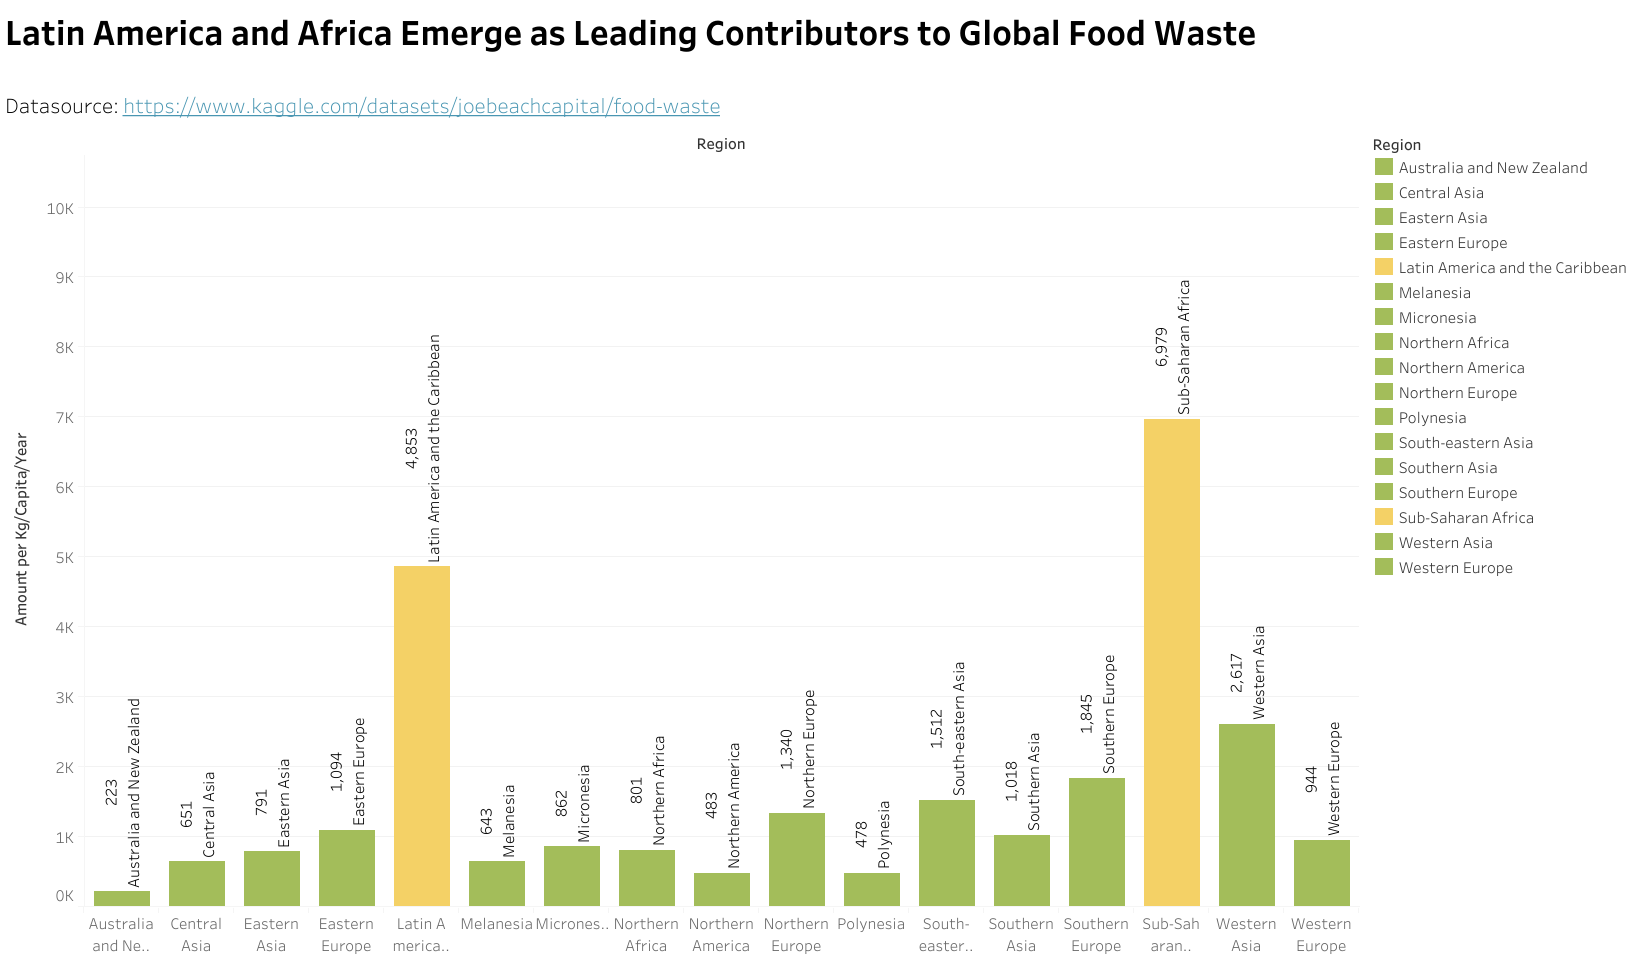
In the examination of food wastage on a global scale, the graph brings forth a compelling narrative, spotlighting the regions that emerge as top contributors to this disconcerting issue. Specifically, when measured in kilograms per capita per year, Latin America and Africa stand out as prominent contributors to the global food wastage challenge.
Data viz link: https://public.tableau.com/views/LatinAmericaandAfricaEmergeasLeadingContributorstoGlobalFoodWaste/FoodWastageeachyearbyeachcountry?:language=en-GB&:sid=&:display_count=n&:origin=viz_share_link
Food Wastage in the USA -Breakdown by Sector (Tonnes/Year)

Data Viz link: https://public.tableau.com/views/TheCulinaryandDomesticSectorsContributetoaStaggering22MillionTonsofAnnualWastage/FoodWastageeachyearbyeachcountry2?:language=en-GB&:sid=&:display_count=n&:origin=viz_share_link
In scrutinizing the landscape of food wastage in the United States, the graph unveils a comprehensive breakdown of the annual figures across key sectors. Notably, the household sector and food service providers share a strikingly similar burden, each contributing approximately 22 million tons of food wastage per year. In contrast, the retail business, while still significant, generates a comparatively lower amount, contributing around 6 million tons annually.
Food Wastage in Pittsburgh
We estimate 89,000 tons of food waste are generated in Pittsburgh each year. Restaurants are the highest food waste producing sector at 30,300 tons of food waste per year followed by residential, totaling 27,900 tons.
The primary contributors to this waste predicament can be attributed to residential sources, accounting for 34% of the total, closely followed by restaurants at 31%.
Reference: https://pittsburghpa.gov/dcp/food-waste


Harmony in Action
As we confront the dual challenges of food price inflation and a growing population unable to afford even a healthy portion of their diet, it prompts reflection on the trajectory we are navigating. While certain factors, such as global food prices, may be beyond our immediate control, our collective ability to address food waste remains within our grasp. In a scenario where financial constraints limit access to nourishing meals for many, juxtaposed with the significant food wastage occurring, a stark contrast emerges. It raises a poignant question about our collective direction. While we may not have the power to alter the pricing dynamics, we certainly possess the agency to make a meaningful impact by sharing surplus food instead of allowing it to go to waste. In doing so, we can bridge the gap between abundance and scarcity, fostering a more compassionate and sustainable food ecosystem.
Got some extra Food ?
That's a wrap!


Photo by Priscilla Du Preez 🇨🇦 on Unsplash
Photo by Priscilla Du Preez 🇨🇦 on Unsplash


References:
https://www.numbeo.com/food-prices/in/Pittsburgh https://www.cbsnews.com/pittsburgh/news/new-report-shows-pennsylvania-ranks-worst-in-u-s-with-inflation-on-grocery-store-prices/ https://fred.stlouisfed.org/series/CUUSA104SAF1 https://www.wesa.fm/economy-business/2022-11-24/more-people-are-calling-the-pittsburgh-food-bank-this-thanksgiving-as-food-costs-rise
https://ourworldindata.org/latest/page/2 https://ourworldindata.org/food-prices#explore-data-on-food-affordability https://ourworldindata.org/grapher/food-expenditure-per-person-per-year?tab=table https://www.kaggle.com/datasets/imtkaggleteam/food-prices-in-world?select=2-+food-expenditure-per-person-per-year.csv
https://www.kaggle.com/datasets/csafrit2/food-prices-in-us-cities