Decoding Crime in Boston:
Data Insights


“In the following chapters present analytical views of Boston's public safety. We'll explore crime trends, demographic factors, and chararcteristics to understand the city's unique security challenges and justice system.”
MOTIVATION:

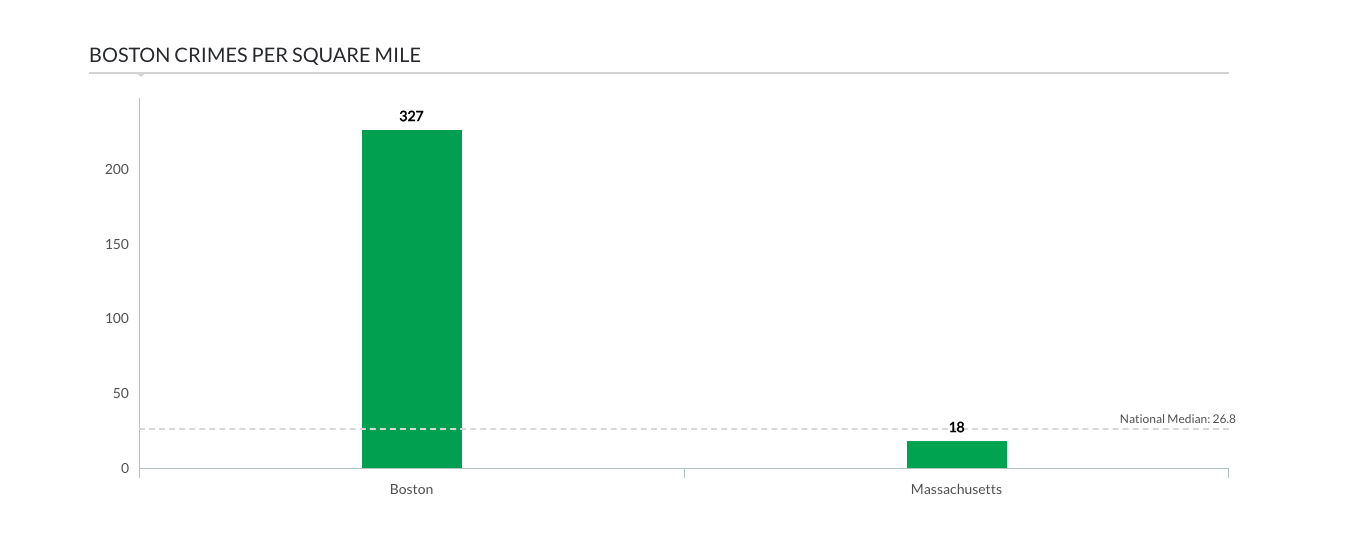
"As we delve into Boston's public safety landscape, it's important to recognize the city's unique context. This chart illustrates Boston's crime rate per square mile stands significantly above both the state and national medians, underscoring the importance of our data-driven approach to crime analysis." the importance of our data-driven approach to crime analysis."
Chapter 1
Crime Time Trends


Daily Analysis

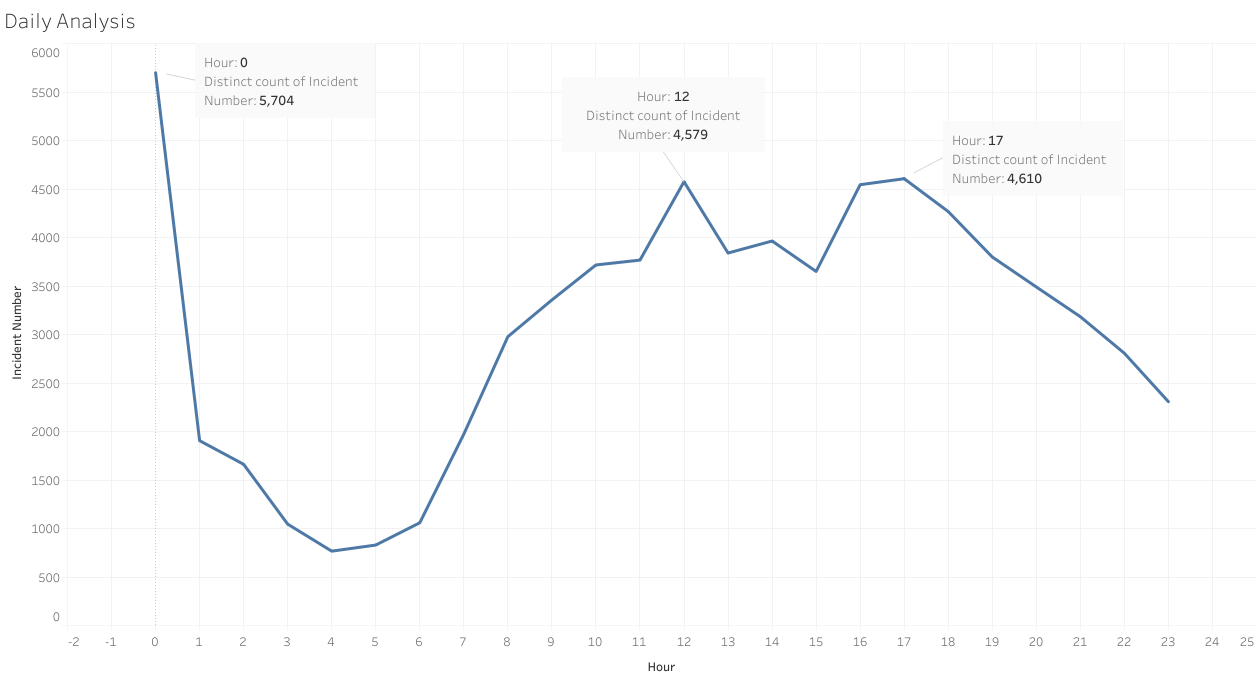
"The graph shows a daily crime pattern: a peak at midnight, and another two rises towards the afternoon and the evening. The midnight peak suggests a need for heightened night patrols, while the evening and the noon rise aligns with rush hour, indicating potential times for increased vigilance."
Weekly Analysis

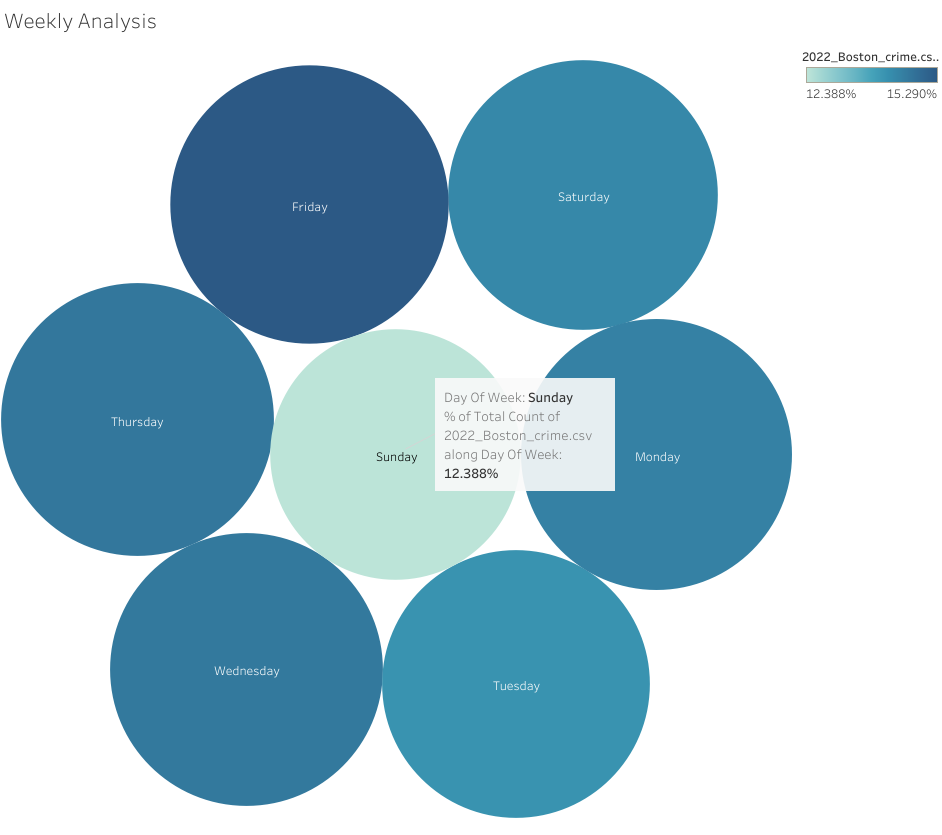
"The bubble chart indicates that crime incidents are fairly evenly distributed throughout the week, with Sunday slightly less active. This suggests a consistent level of vigilance is required daily, with a possible decrease in incidents to anticipate on Sundays."
Monthly Analysis

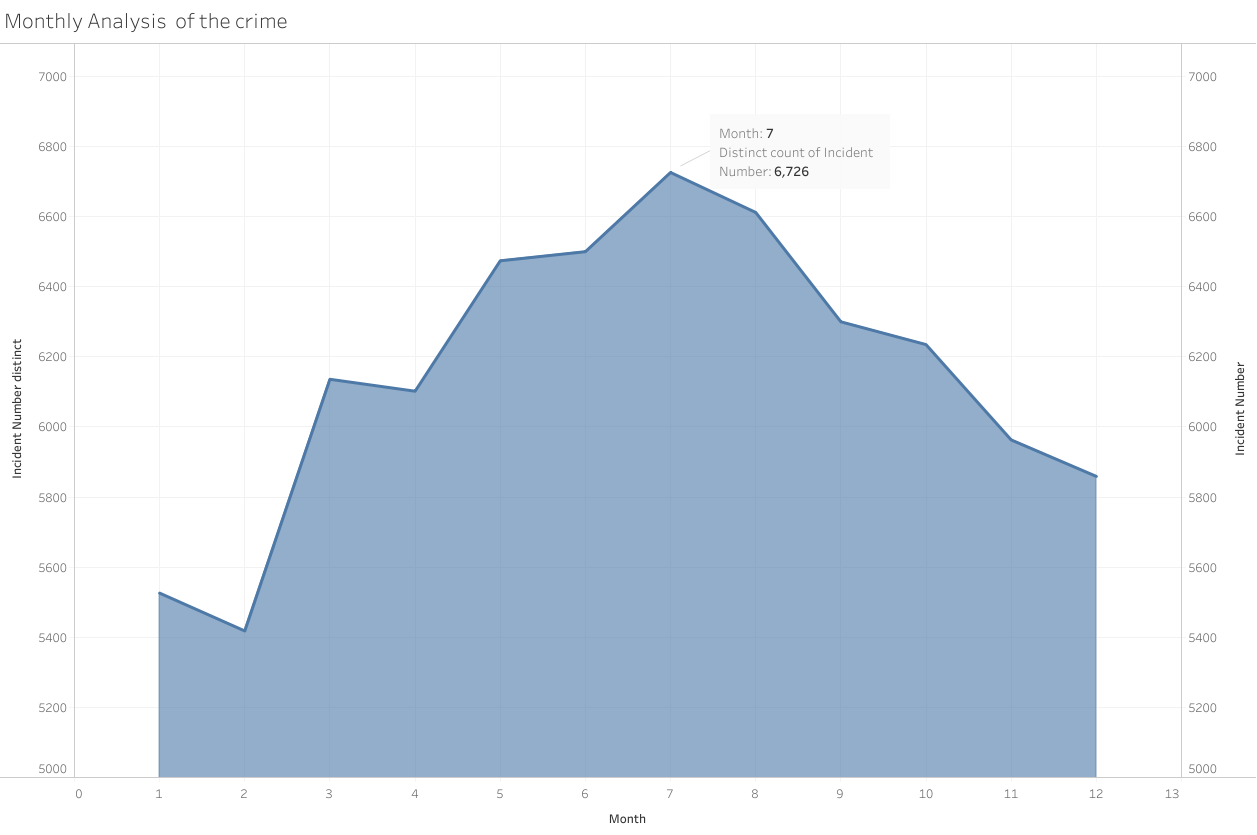
A pattern emerges with July peaking(During Summer holidays), indicating seasonal variations in crime rates. Understanding these trends can guide preventive measures.”
Yearly Analysis

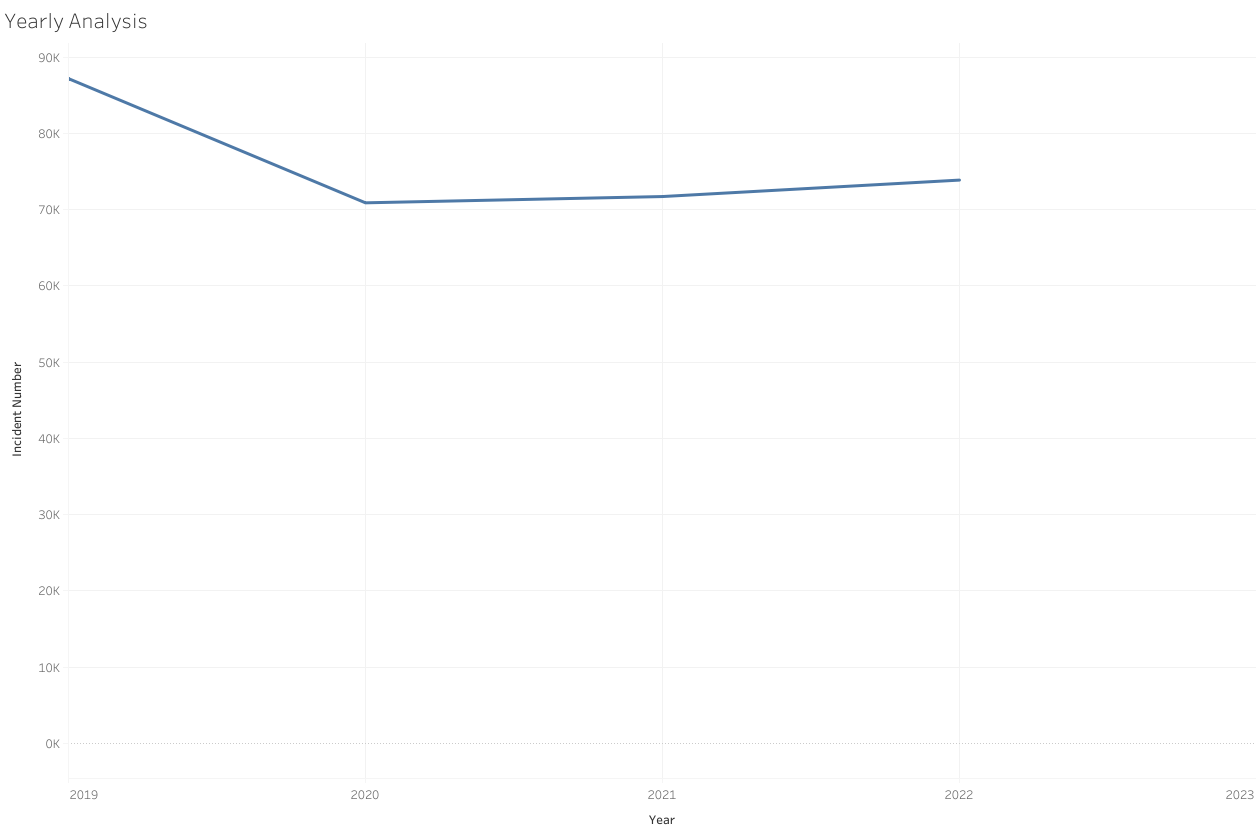
"Turning to the annual view, we observe the trajectory of crime incidents over the years. After a notable decline in 2020, possibly due to pandemic-related restrictions, the incident numbers have plateaued. This year-to-year analysis is pivotal in understanding long-term trends and preparing for future public safety strategies."
Chapter 2
Regional Analytics Of The Crime


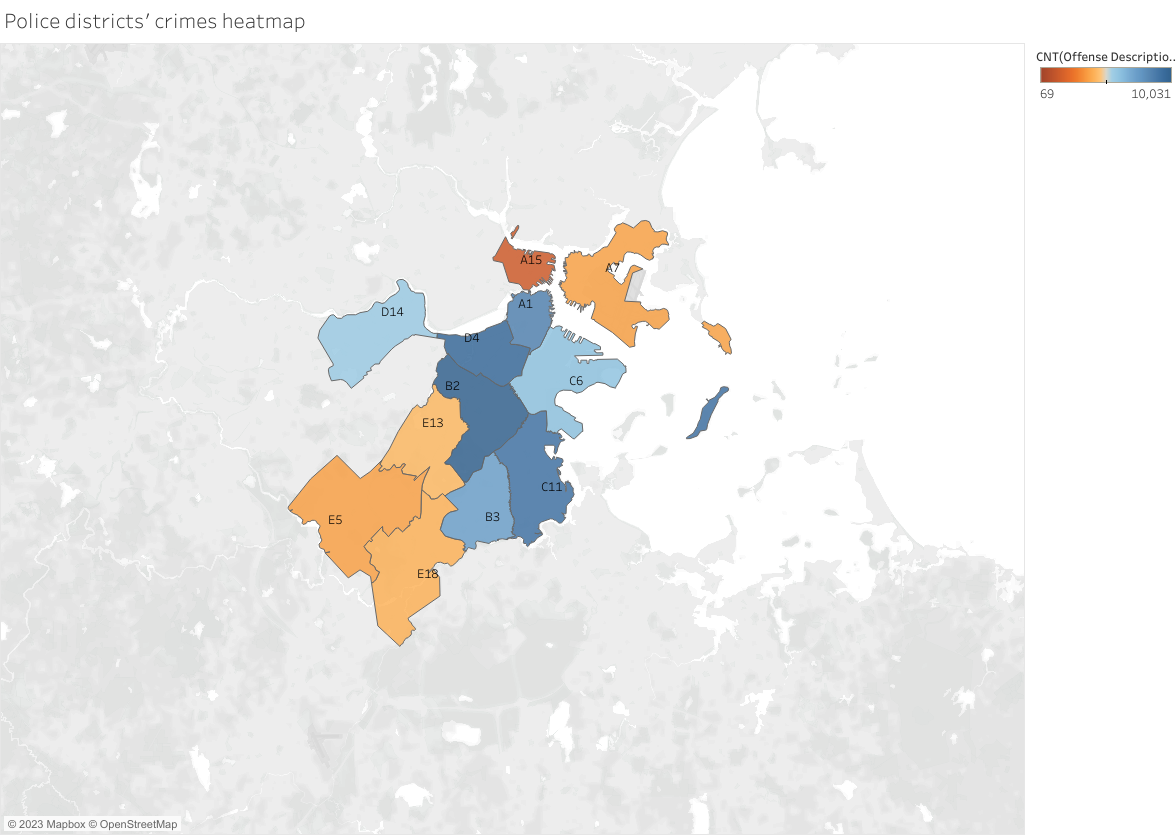
“This heatmap indicates the varying crime densities across Boston's police districts, guiding residents and visitors for heightened awareness and aiding officials in focusing enforcement efforts.”
"The heart of Boston, covering police districts B2, D4, C6, and A1, shows a higher crime frequency, underscoring the need for a focused approach. Enhanced patrols, especially during peak hours, community engagement initiatives, and improved urban design could deter criminal activities. Public awareness campaigns can further bolster the safety of both residents and visitors in these bustling areas of our city."
Chapter 3
Crime Description Analytics


Crime Description Analytics
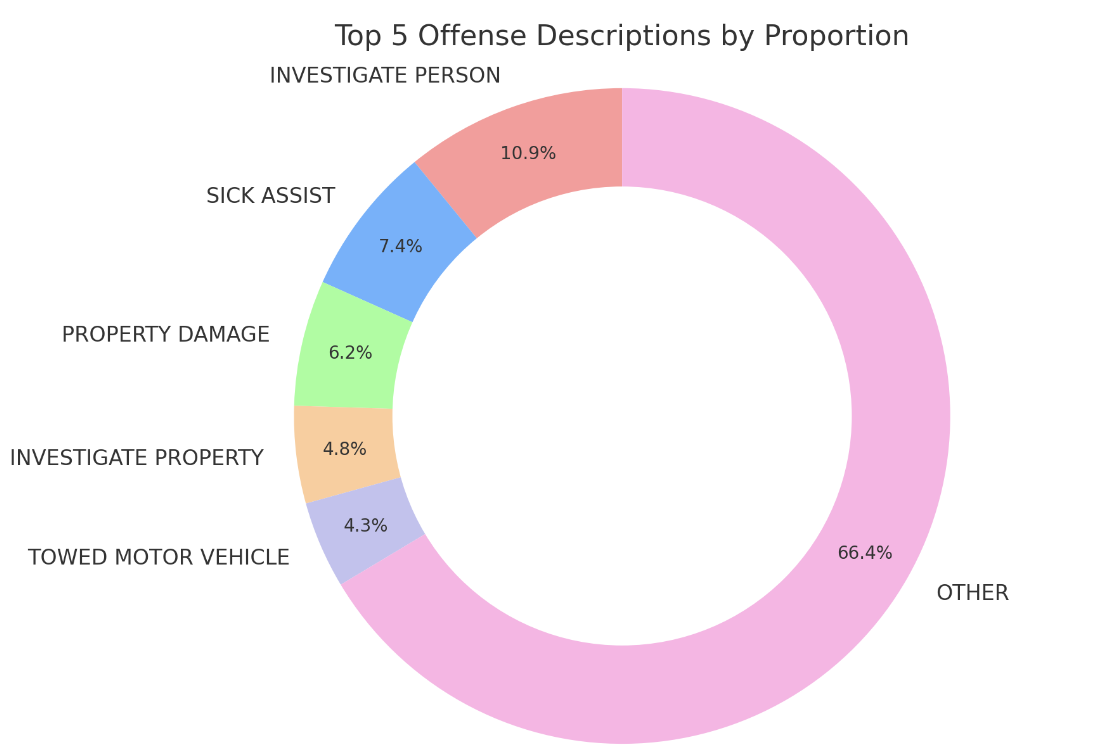
Our analysis indicates that while a majority of incidents fall into the 'other' category, there are significant proportions of specific offenses like 'Investigate Person' and 'Property Damage.' This data suggests the need for targeted interventions focusing on personal safety and property security, alongside broader crime prevention strategies."
Chapter 4
Call To Action


The data indicates that proactive measures specifically targeting high-risk areas and times can significantly impact overall safety. We recommend the following steps:
- Increased Patrols: Allocate more patrols during peak crime hours, especially in identified high-risk districts.
- Community Engagement: Implement community outreach programs to educate the public on safety measures and encourage community-led surveillance.
- Focused Resources: Direct resources to the most affected areas, with particular attention to the types of crimes most prevalent in those neighborhoods.
- Data Monitoring: Continuously monitor crime data to swiftly adapt to changing patterns and emerging threats.
- Public Awareness: Launch awareness campaigns about crime hotspots and safety tips, especially directed at tourists and new residents.
Reference:
Data:
1. https://data.boston.gov/dataset/boston-police-stations
2. https://police.boston.gov/districts/
3. https://ucr.fbi.gov/crime-in-the-u.s/2019/crime-in-the-u.s.-2019/tables/table-8/table-8-state-cuts/massachusetts.xls
Media:
1. https://www.city-data.com/crime/crime-Boston-Massachusetts.html
2. https://www.neighborhoodscout.com/ma/boston/crime