Colorado River Levels and Population Growth
Exploring Water in the American Southwest

As a child living in the Great Lakes region, I had a pen pal in Colorado. As part of our correspondence, I would often ask if she had experienced any rain recently. I don't recall ever receiving an affirmative response to this question, as Colorado was in the middle of the long early 21st-century drought (4). This was incredible to seven-year-old me, who lived in one of the most fresh water-abundant places on earth. That hardly made it less real, though. Despite the fact that water shortages might appear to be a localized phenomenon relevant only to the residents of a few states, the water level is impacted by factors reaching far beyond the southwestern United States.

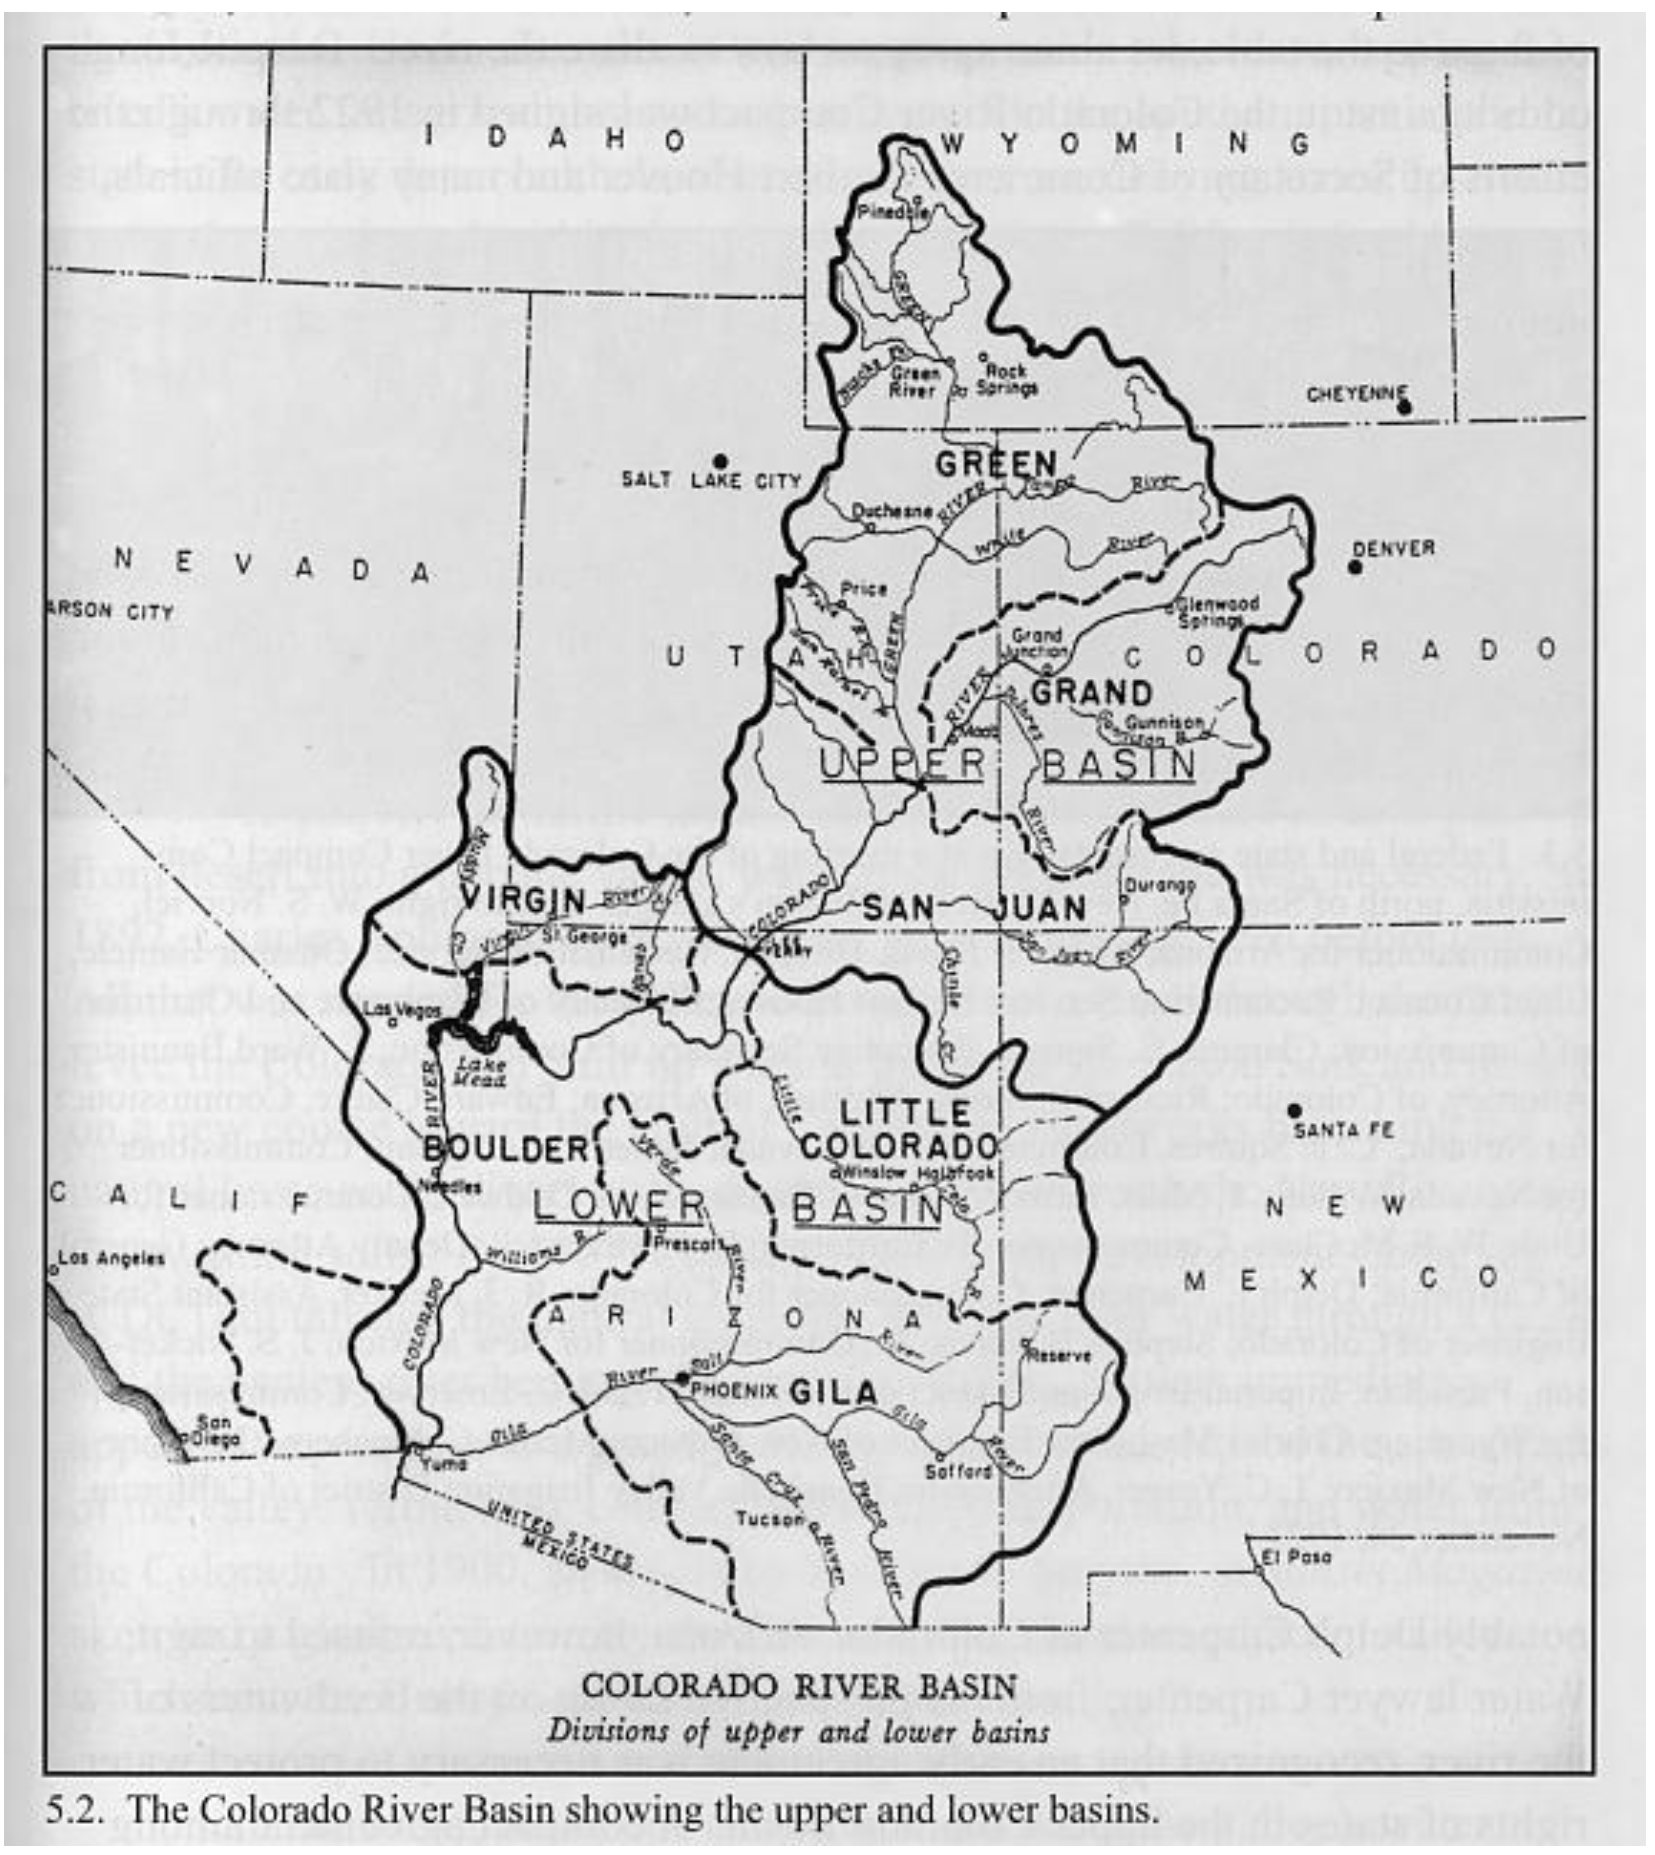
Library of Congress map https://www.loc.gov/item/2008676799/
Library of Congress map https://www.loc.gov/item/2008676799/
The Colorado River is the main water source for several states in the US, with its basin starting in Wyoming with numerous tributaries and eventually flowing down to the Gulf of California in Mexico, though its delta has been mostly dry for some years now (2,3).
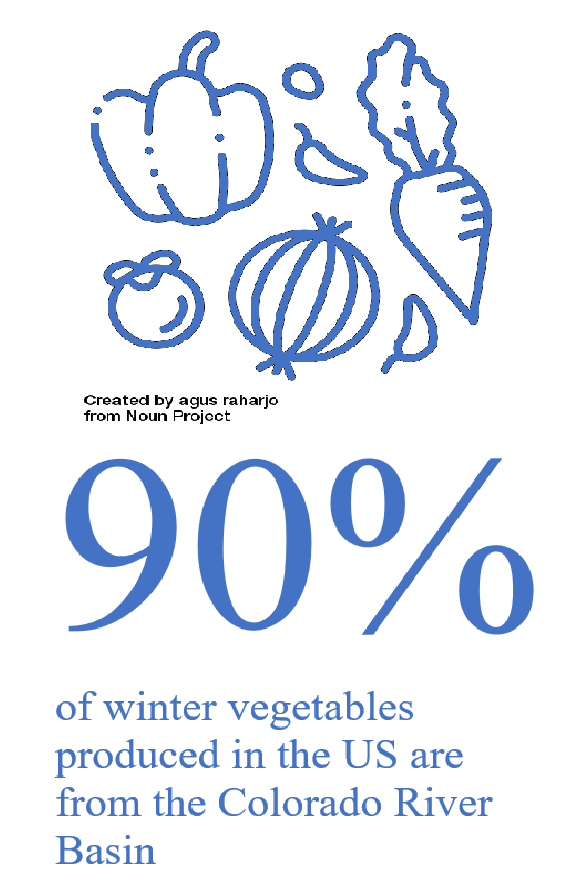
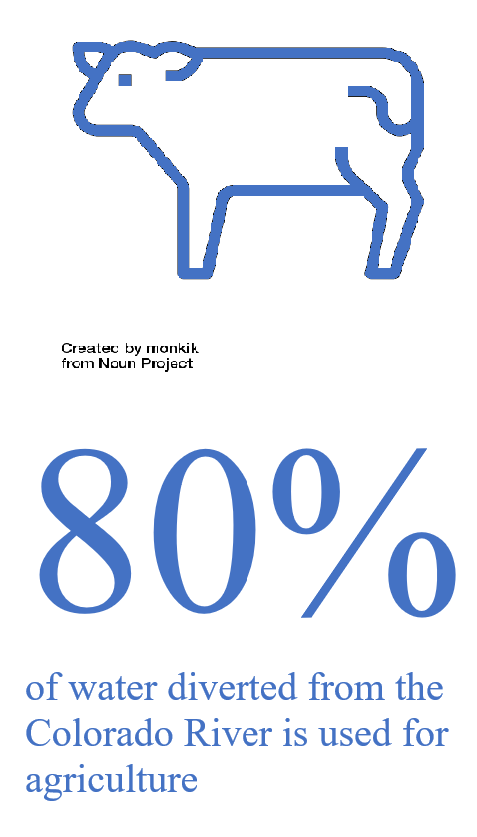
This drying of the lower river is largely attributed to agricultural usage, which uses up 80% of the water that is taken out of the river. Half of that goes toward growing cattle feed. (8). Although only 15% of the nation's farmland is fed by this river, a whopping 90% of our winter vegetables are watered by it (8). Clearly, certain industries depend heavily on this one water source.
How much of this unsustainable water usage is preventable, anyways? It's hard to say, but maybe we can start by looking at a factor that isn't going away anytime soon and isn't preventable: population growth. Perhaps the underlying reason behind most aspects of human-controllable water depletion, population growth is unavoidable and will undoubtedly continue.
So, let's delve into the ties between population growth and the Colorado River's water throughput.


One Hundred Years of Water


When it comes to tracking long-term climate trends, there is a remarkably short record of data. While we might wish we knew what the pre-Columbian water levels were, most ecological and climate data collection didn't start until around the beginning of the twentieth century. Here, we will stay with the timeframe in which data has been consistently collected and not make any claims about older conditions.
We'll start by examining water levels at the US Geological Survey's (USGS) Grand Canyon collection point. Arizona is the last state the River travels through before reaching the border with Mexico, and the collection point near the Grand Canyon has been the most consistently monitored over the last 100 years. This station measures average throughput, in cubic feet per second.
The USGS collects data daily and aggregates it annually, but average throughput varies widely year to year and it can be difficult to glean any meaningful information from a single year's data. For that reason, we're going to be smoothing, i.e. averaging, the data over ten-year periods, which will give us a more meaningful picture of the data (don't grow too alarmed over the endpoint spike/dropoff; it's a bit exaggerated when smoothing like this).


Source: https://waterdata.usgs.gov/nwis/annual?referred_module=sw&search_site_no=09402500&format=sites_selection_links
As we can see, water levels have been declining, especially since the 1980s. But does this have anything to do with how many people live near the river? After all, humans are the ones diverting the water flow. Let's examine population growth over the same time frame.
One Hundred Years of People
The US Census Bureau takes census data every ten years, which makes it easy to compare with our river throughput data. Let's examine population growth for the US since 1920.

Source: https://www.census.gov/data/tables/time-series/dec/popchange-data-text.html
Perhaps local population growth is a stronger factor in determining river levels, though. After all, wouldn't locals be the ones who directly consume the river water? With that in mind, let's focus just on the census region that encompasses the river -- the West.

Source: https://www.census.gov/data/tables/time-series/dec/popchange-data-text.html
This assumption sounds logical until we examine the data further. If we look at the correlation between water levels and population, there's actually stronger correlation and higher statistical significance between the population of the US that isn't in the West and throughput decline than there is between the population in the West and throughput decline. This suggests that underlying causes in river levels are determined by non-local factors more than local factors.
Using the ten-year average of river throughput during years when the census was taken, let's examine these correlations.
First, let's look at the correlation between throughput and the US population at large:

Sources: https://www.census.gov/data/tables/time-series/dec/popchange-data-text.html, https://waterdata.usgs.gov/nwis/annual?referred_module=sw&search_site_no=09402500&format=sites_selection_links
Next, let's split the population into the "West" census region and the rest of the country and see if the correlation is different

Sources: https://www.census.gov/data/tables/time-series/dec/popchange-data-text.html, https://waterdata.usgs.gov/nwis/annual?referred_module=sw&search_site_no=09402500&format=sites_selection_links
Not familiar with statistics? No problem! Here's what you need to know: The R-Squared value on the dashed line indicates what percentage of the changes in the data on the x-axis can be explained by the data on the y-axis. The p-value indicates whether this correlation is statistically meaningful, with any p below 0.05 generally considered significant.
This is an interesting observation that could lead to a couple of different conclusions.
First, we should look at what we already know. Agriculture accounts for 80% of water use from the Colorado River, and an increase in agriculture won't necessarily cause a significant increase in local population growth. It will, however, cause a decrease in water throughput further downstream. And an increase in agriculture in the first place could be caused by population growth elsewhere in the country.
There might be other explanations, as well. Some like to blame climate change and unsustainable farming practices, and many states have strict anti-rainwater collection laws (12). These might all be factors, but ultimately, it's difficult to argue with the idea that about 45% of the reason for the Colorado River's throughput is either directly or indirectly caused by changes in the population.
What Now?
So, what can we do about less water being available in the western part of the country? As an individual, you might not have a huge impact alone, but if enough people make small changes in consumption habits and demand change from their state and local governments, they can make an impact together.
Instead of looking toward far-reaching, sometimes unrealistic goals, such as encouraging population decline, let's look at some practical steps that could actually have an impact and help us stop contributing to the problem as individuals.
For those who don't live in one of the seven Colorado River Basin states (Wyoming, Colorado, Utah, Nevada, California, Arizona, and New Mexico):
- Check where your produce comes from, particularly winter vegetables. Consider growing your own or purchasing locally rather than from a basin state.
- Check where your beef and dairy products come from or, better yet, opt for grass-fed beef and dairy.
- Checking the source of the cotton products we use is an option for those of us ambitious enough to put in the effort
For those of us who live in a basin state:
- Be an activist! Call on your local and state government to implement sustainable, practical rules for the agriculture industry.
- Be mindful if each candidate's stance on water when voting and talk to friends and family about your stance.
- This is particularly important in California, which consumes more of the river's water than any other state (10,11)
Recently, the state of Arizona decided to end a foreign company's ability to pull on its water supply for their own agricultural usage (9). If enough people are unhappy with certain practices, officials will often have to act.

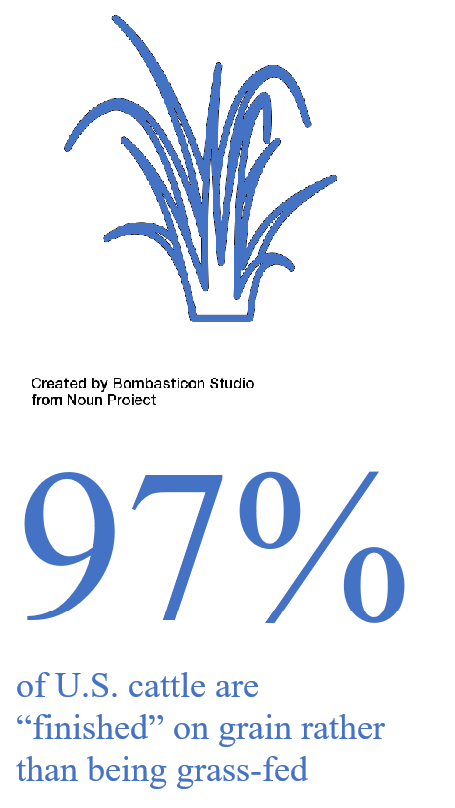

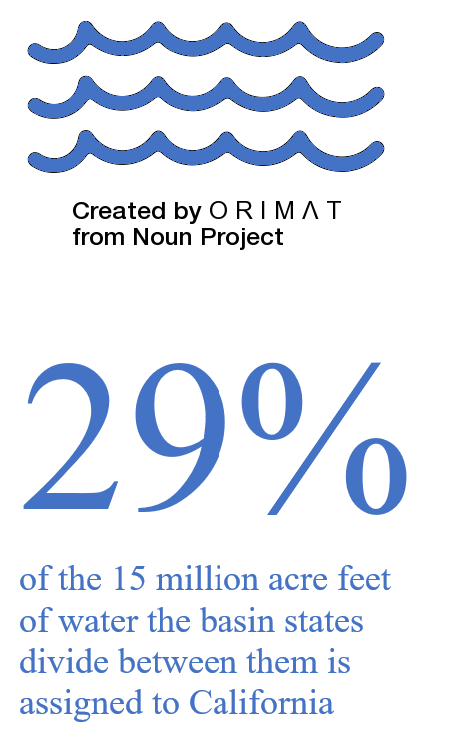


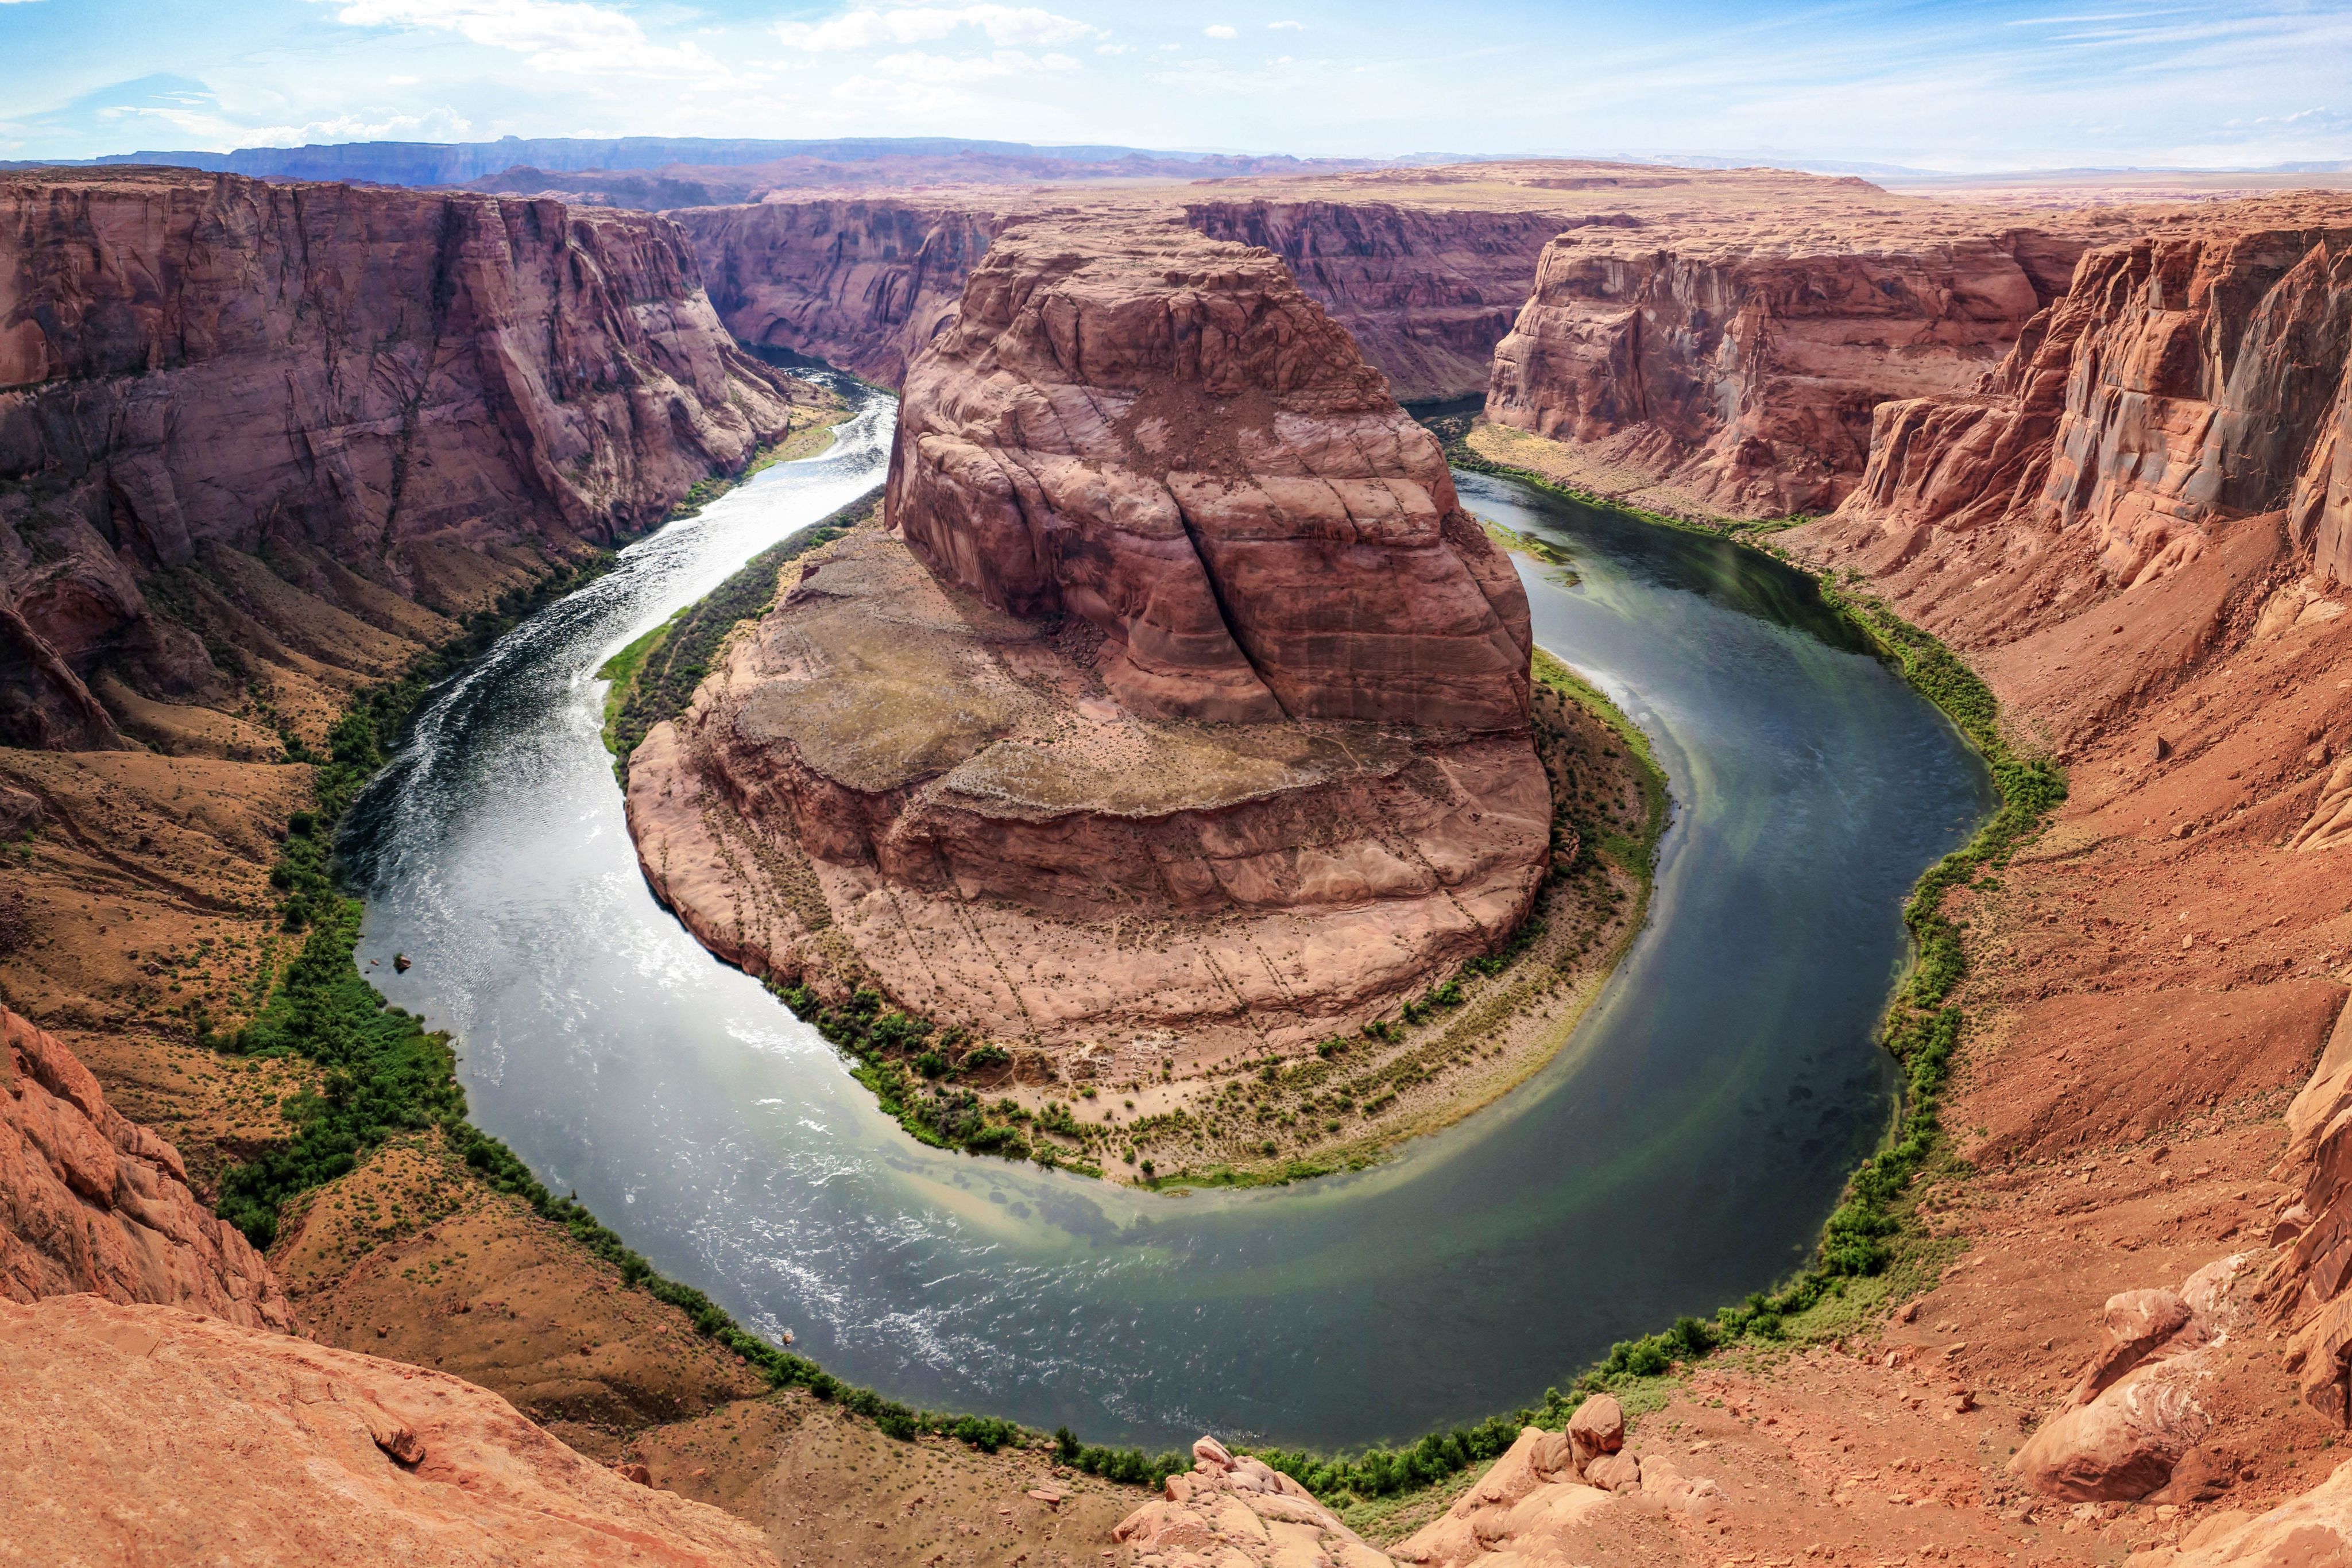
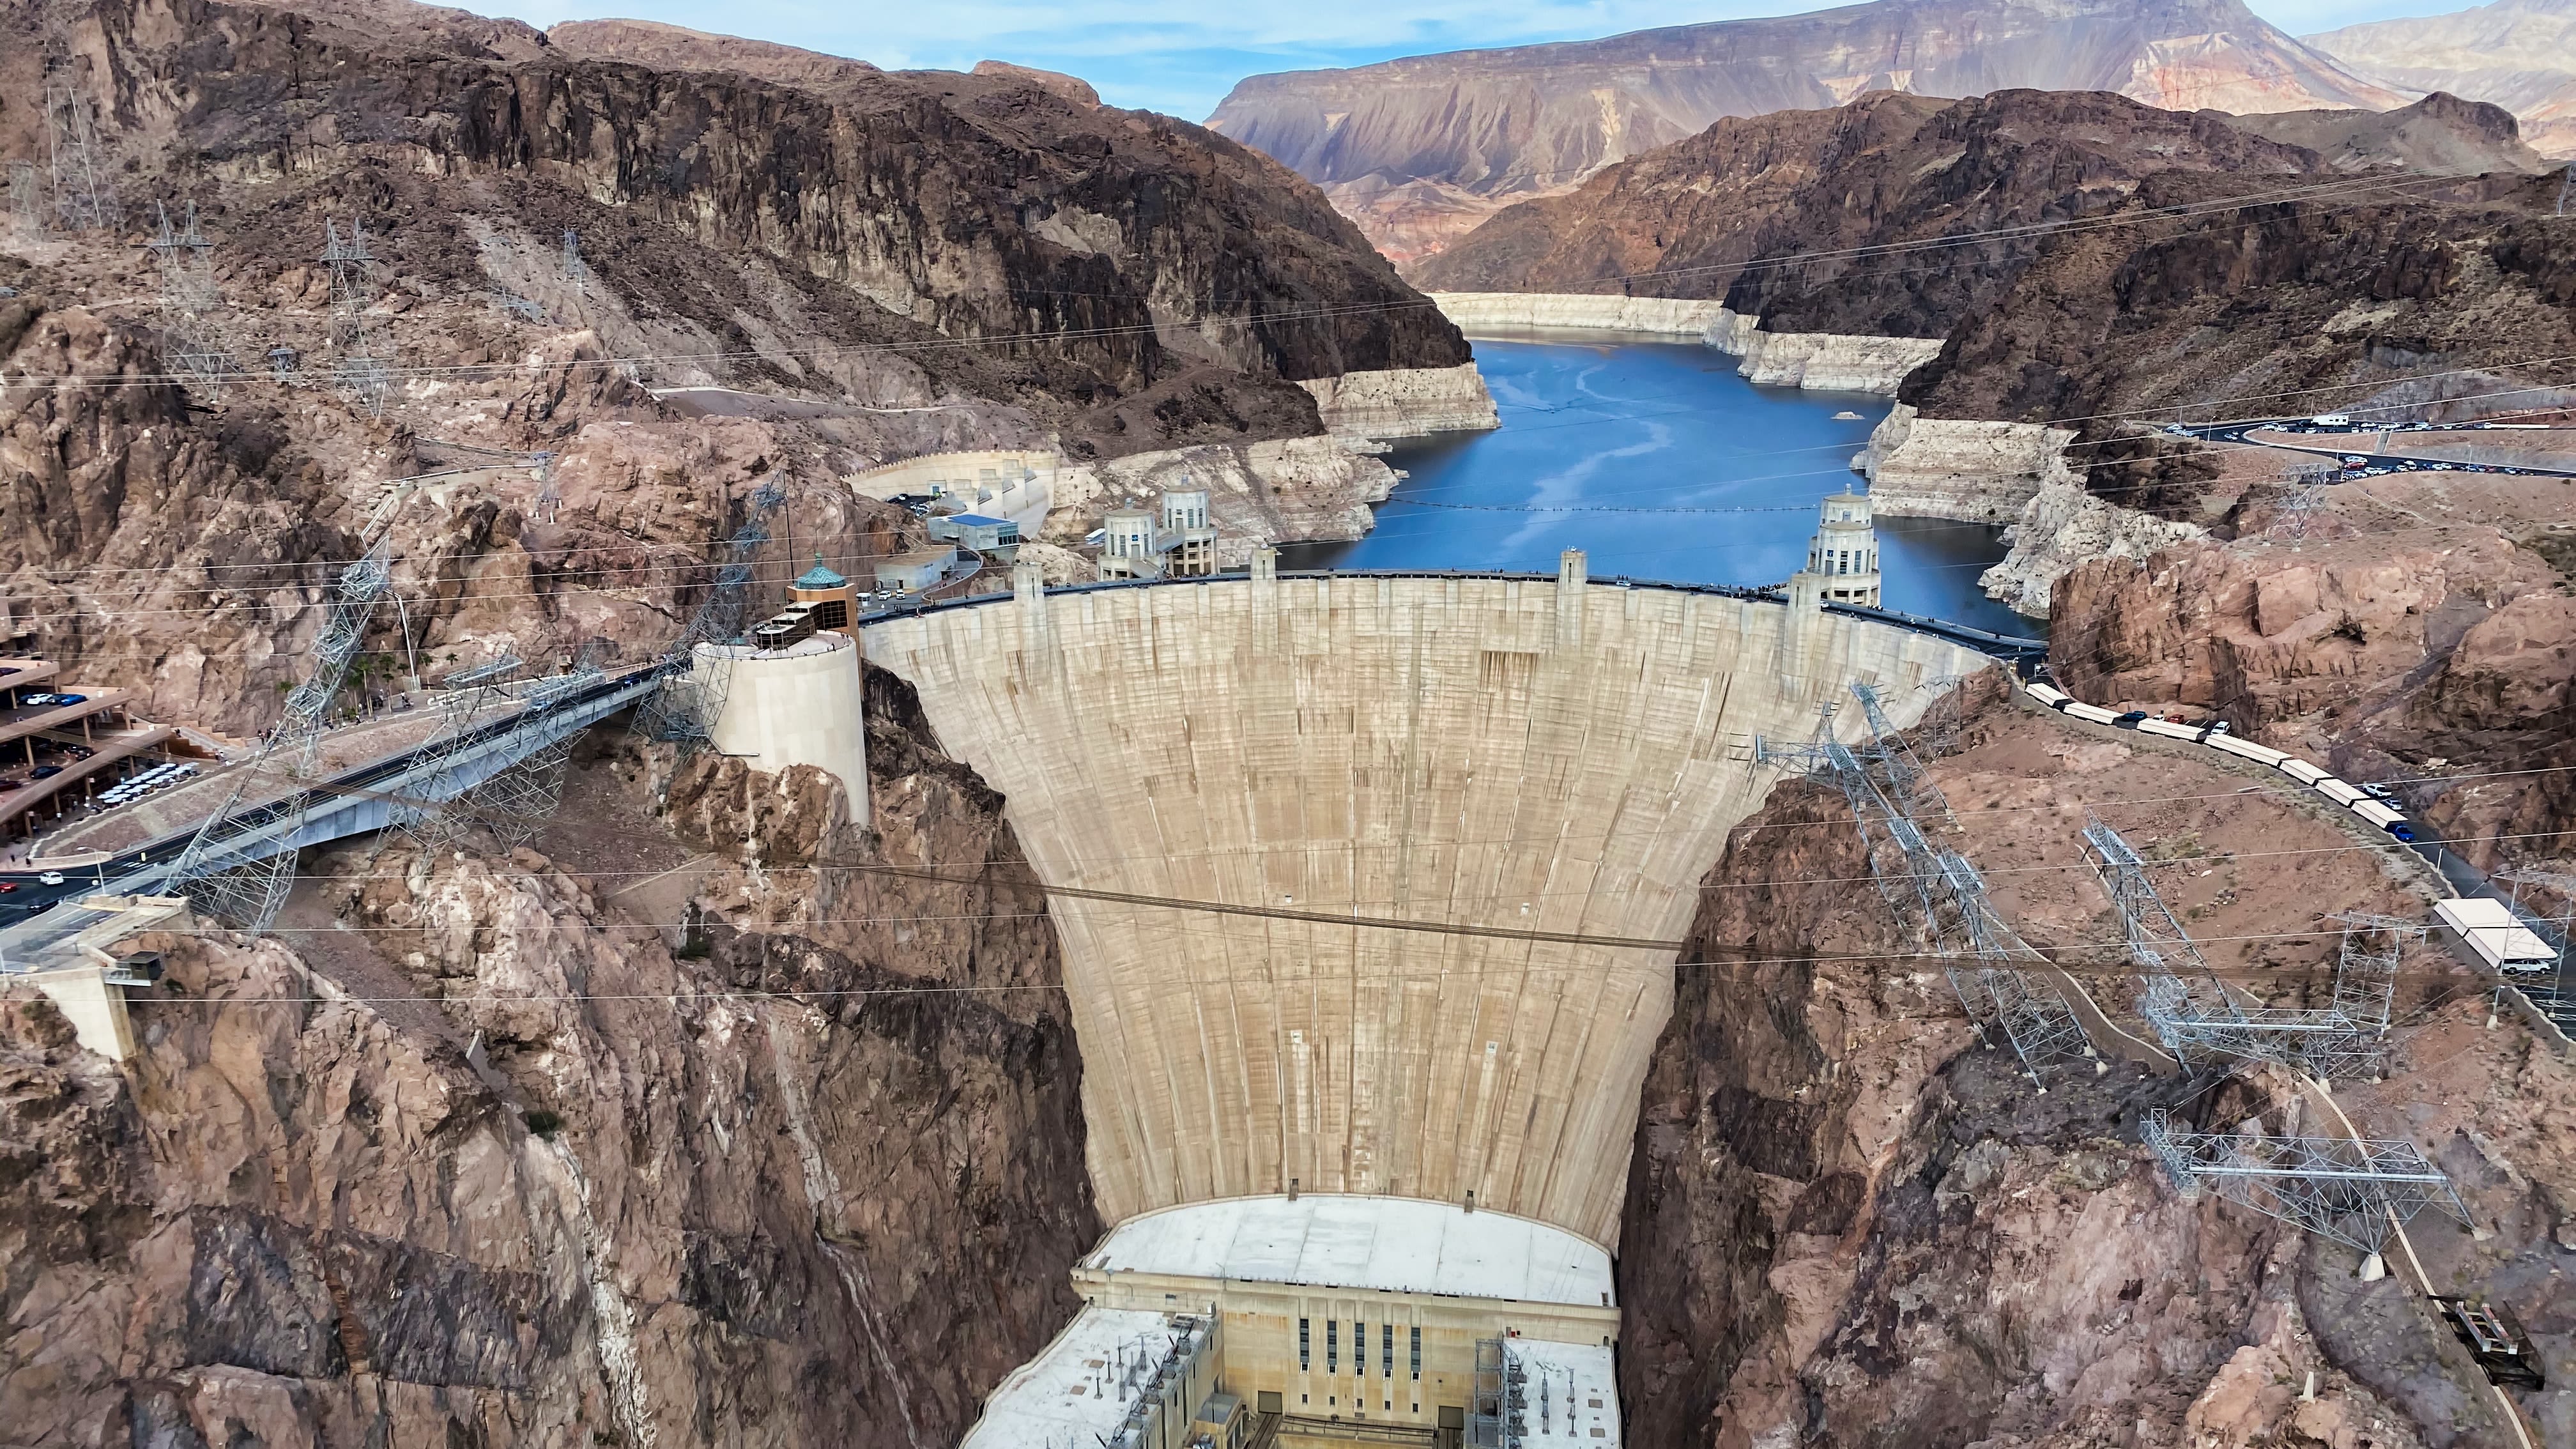
Photo by Shelley Pauls on Unsplash
Photo by Shelley Pauls on Unsplash
The Colorado River might have less water than ever recorded before, but there's no reason to assume we can't reverse this course of action through sensible, sustainable policies and responsible personal decisions.
Words: Abigail Brown
Editor: Abigail Brown
Photos: Unsplash
Design: Abigail Brown
Sources
- https://www.uncovercolorado.com/activities/colorado-river/
- https://www.latimes.com/environment/story/2023-01-31/colorado-river-in-crisis-the-rivers-end
- https://www.washingtonpost.com/climate-environment/2023/02/05/colorado-river-drought-explained/
- https://www.drought.gov/what-is-drought/historical-drought#:~:text=The%20three%20longest%20drought%20episodes,early%2021st-century%20drought
- https://www.census.gov/data/tables/time-series/dec/popchange-data-text.html
- https://waterdata.usgs.gov/nwis/annual?referred_module=sw&search_site_no=09402500&format=sites_selection_links
- https://www.loc.gov/item/2008676799/
- https://feedingourselvesthirsty.ceres.org/regional-analysis/colorado-river
- https://www.msn.com/en-us/news/us/arizona-moves-to-end-saudi-farms-controversial-groundwater-deals-to-grow-export-alfalfa/ar-AA1hBtrB#image=1
- https://calmatters.org/environment/2022/08/colorado-river-water-california/
- https://www.npr.org/2022/10/04/1126240060/meet-the-california-farmers-awash-in-colorado-river-water-even-in-a-drought
- https://www.energy.gov/femp/rainwater-harvesting-regulations-map
- https://www.nrdc.org/resources/feedlot-operations-why-it-matters
- https://thenounproject.com/
Callout statistics from and 8 and 13