A Look at Lawrenceville
and Gentrification

Lawrenceville: A Quick History
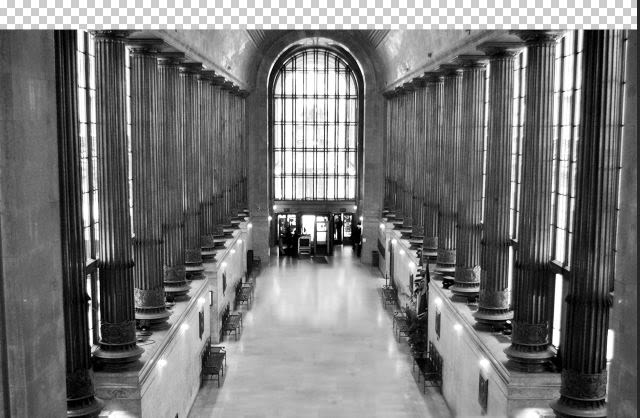
Lawrenceville is a neighborhood of Pittsburgh, PA that, today, is a very trendy spot but it wasn't always that way. Up until 2009, Lawrenceville was a simple blue-collar neighborhood. Then UPMC's Children's Hospital was built on Penn, spurring a new wave of interest and investment in the area.
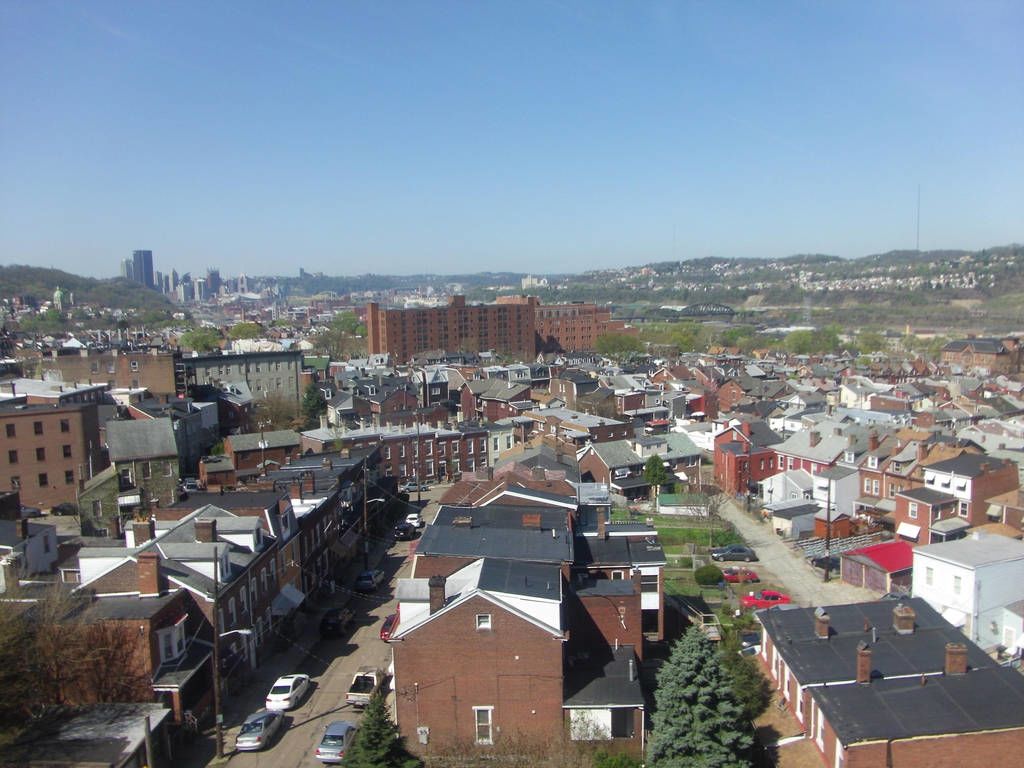
Property values rose with the number of lively bars, restaurants and art galleries, and it is generally understood that, as of 2017, Lawrenceville was officially gentrified. It was even featured in Pittsburgh's Post Gazette.
Photo Credit
What is Gentrification, Anyway?
Gentrification is characterized as a low-income area conforming to middle-class tastes, like replacing charming mom-and-pop shops with national chains or more expensive restaurants. While gentrification is not inherently bad, most people know gentrification as the force that pushes families and long-time residents out of neighborhoods to make way for middle-class (typically white) families to take their place. With the proper policies in place, gentrification can bring reinvestment and economic development without displacement, but this is either rare or rarely makes it into the news.
While it is undeniable that Lawrenceville has been gentrified, was it done poorly? If so, there should be a measurable effect on the neighborhood: increased home values, significant demographic changes, and increased incomes.
By looking at census data from before and after 2009, we can see if there is a significant difference between Lawrenceville before and after gentrification.
Photo Credit; Kraynick's Bike Shop Inc.; Artisan
Data
Using census data for zip code 15201 (Lawrenceville) from American Fact Finder, I was able to look at demographic, income and housing data from 2000, 2010 and 2017 5 year estimates. Using all three years I was able to see the lasting impact that gentrification may have had on Lawrenceville.
More about the planning and preparation that went into this presentation, including initial data sketches and responses to interviews about those sketches, can be found here.
Findings
Population and Demographics
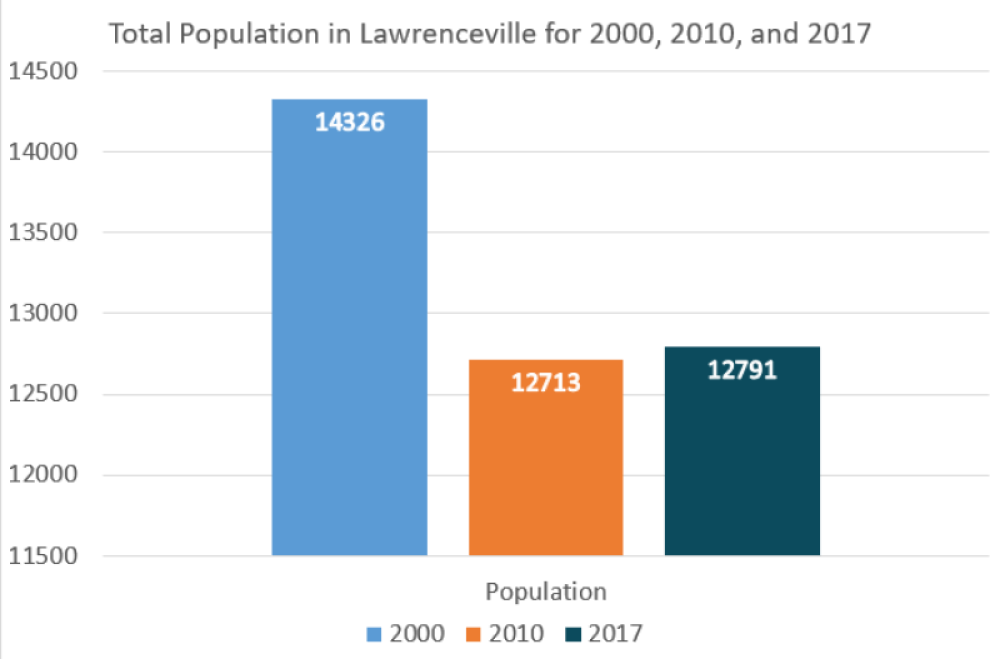
The first metrics I looked at were demographics and population. Gentrification is known to decrease the amount of diversity in an area and even decrease the capacity of a neighborhood (the number of people who can live in a space). The bar chart to the right shows a large decrease in population from 2000 to 2010 and a slight increase from 2010 to 2017.
Demographically, 2010 was Lawrenceville's most diverse year, with 30% non-white residents, but that decreased in 2017 to 22% non-white.
This alone does not prove that Lawrenceville was harmed by gentrification but the reduced population suggests that families did have to move out of the neighborhood. Next we will look at homes' values to see if increased property taxes could have been what pushed people out of the area.

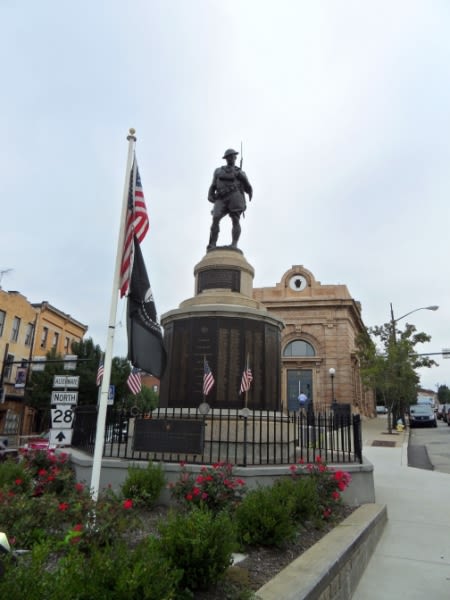
A monument commissioned by Lawrenceville residents to honor soldiers who served in WWI
A monument commissioned by Lawrenceville residents to honor soldiers who served in WWI

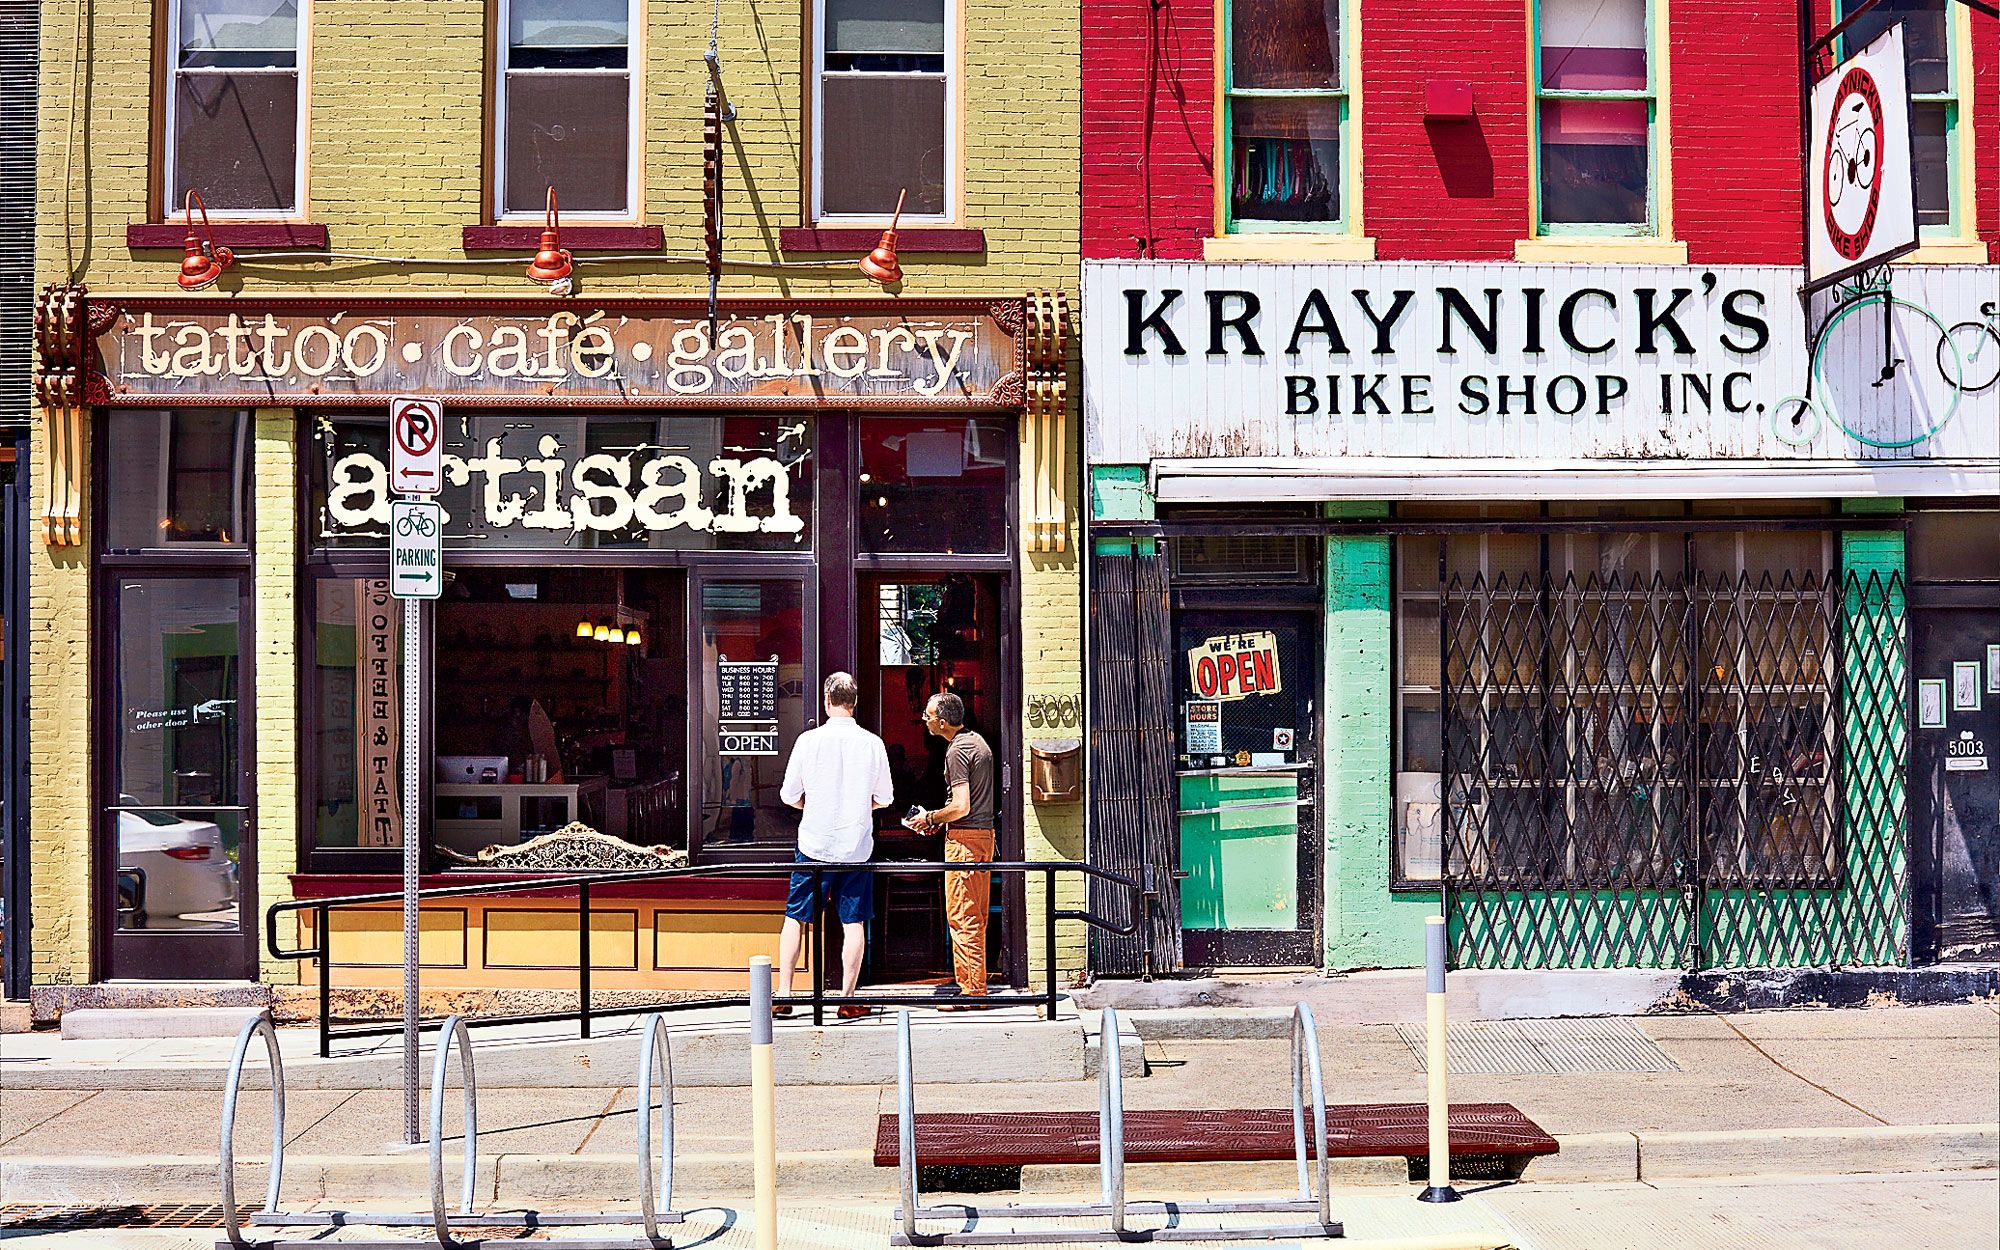
Kraynick's Bike shop is a neighborhood staple- Established in 1946. Artisan is a new shop that moved into town in 2011.
Kraynick's Bike shop is a neighborhood staple- Established in 1946. Artisan is a new shop that moved into town in 2011.


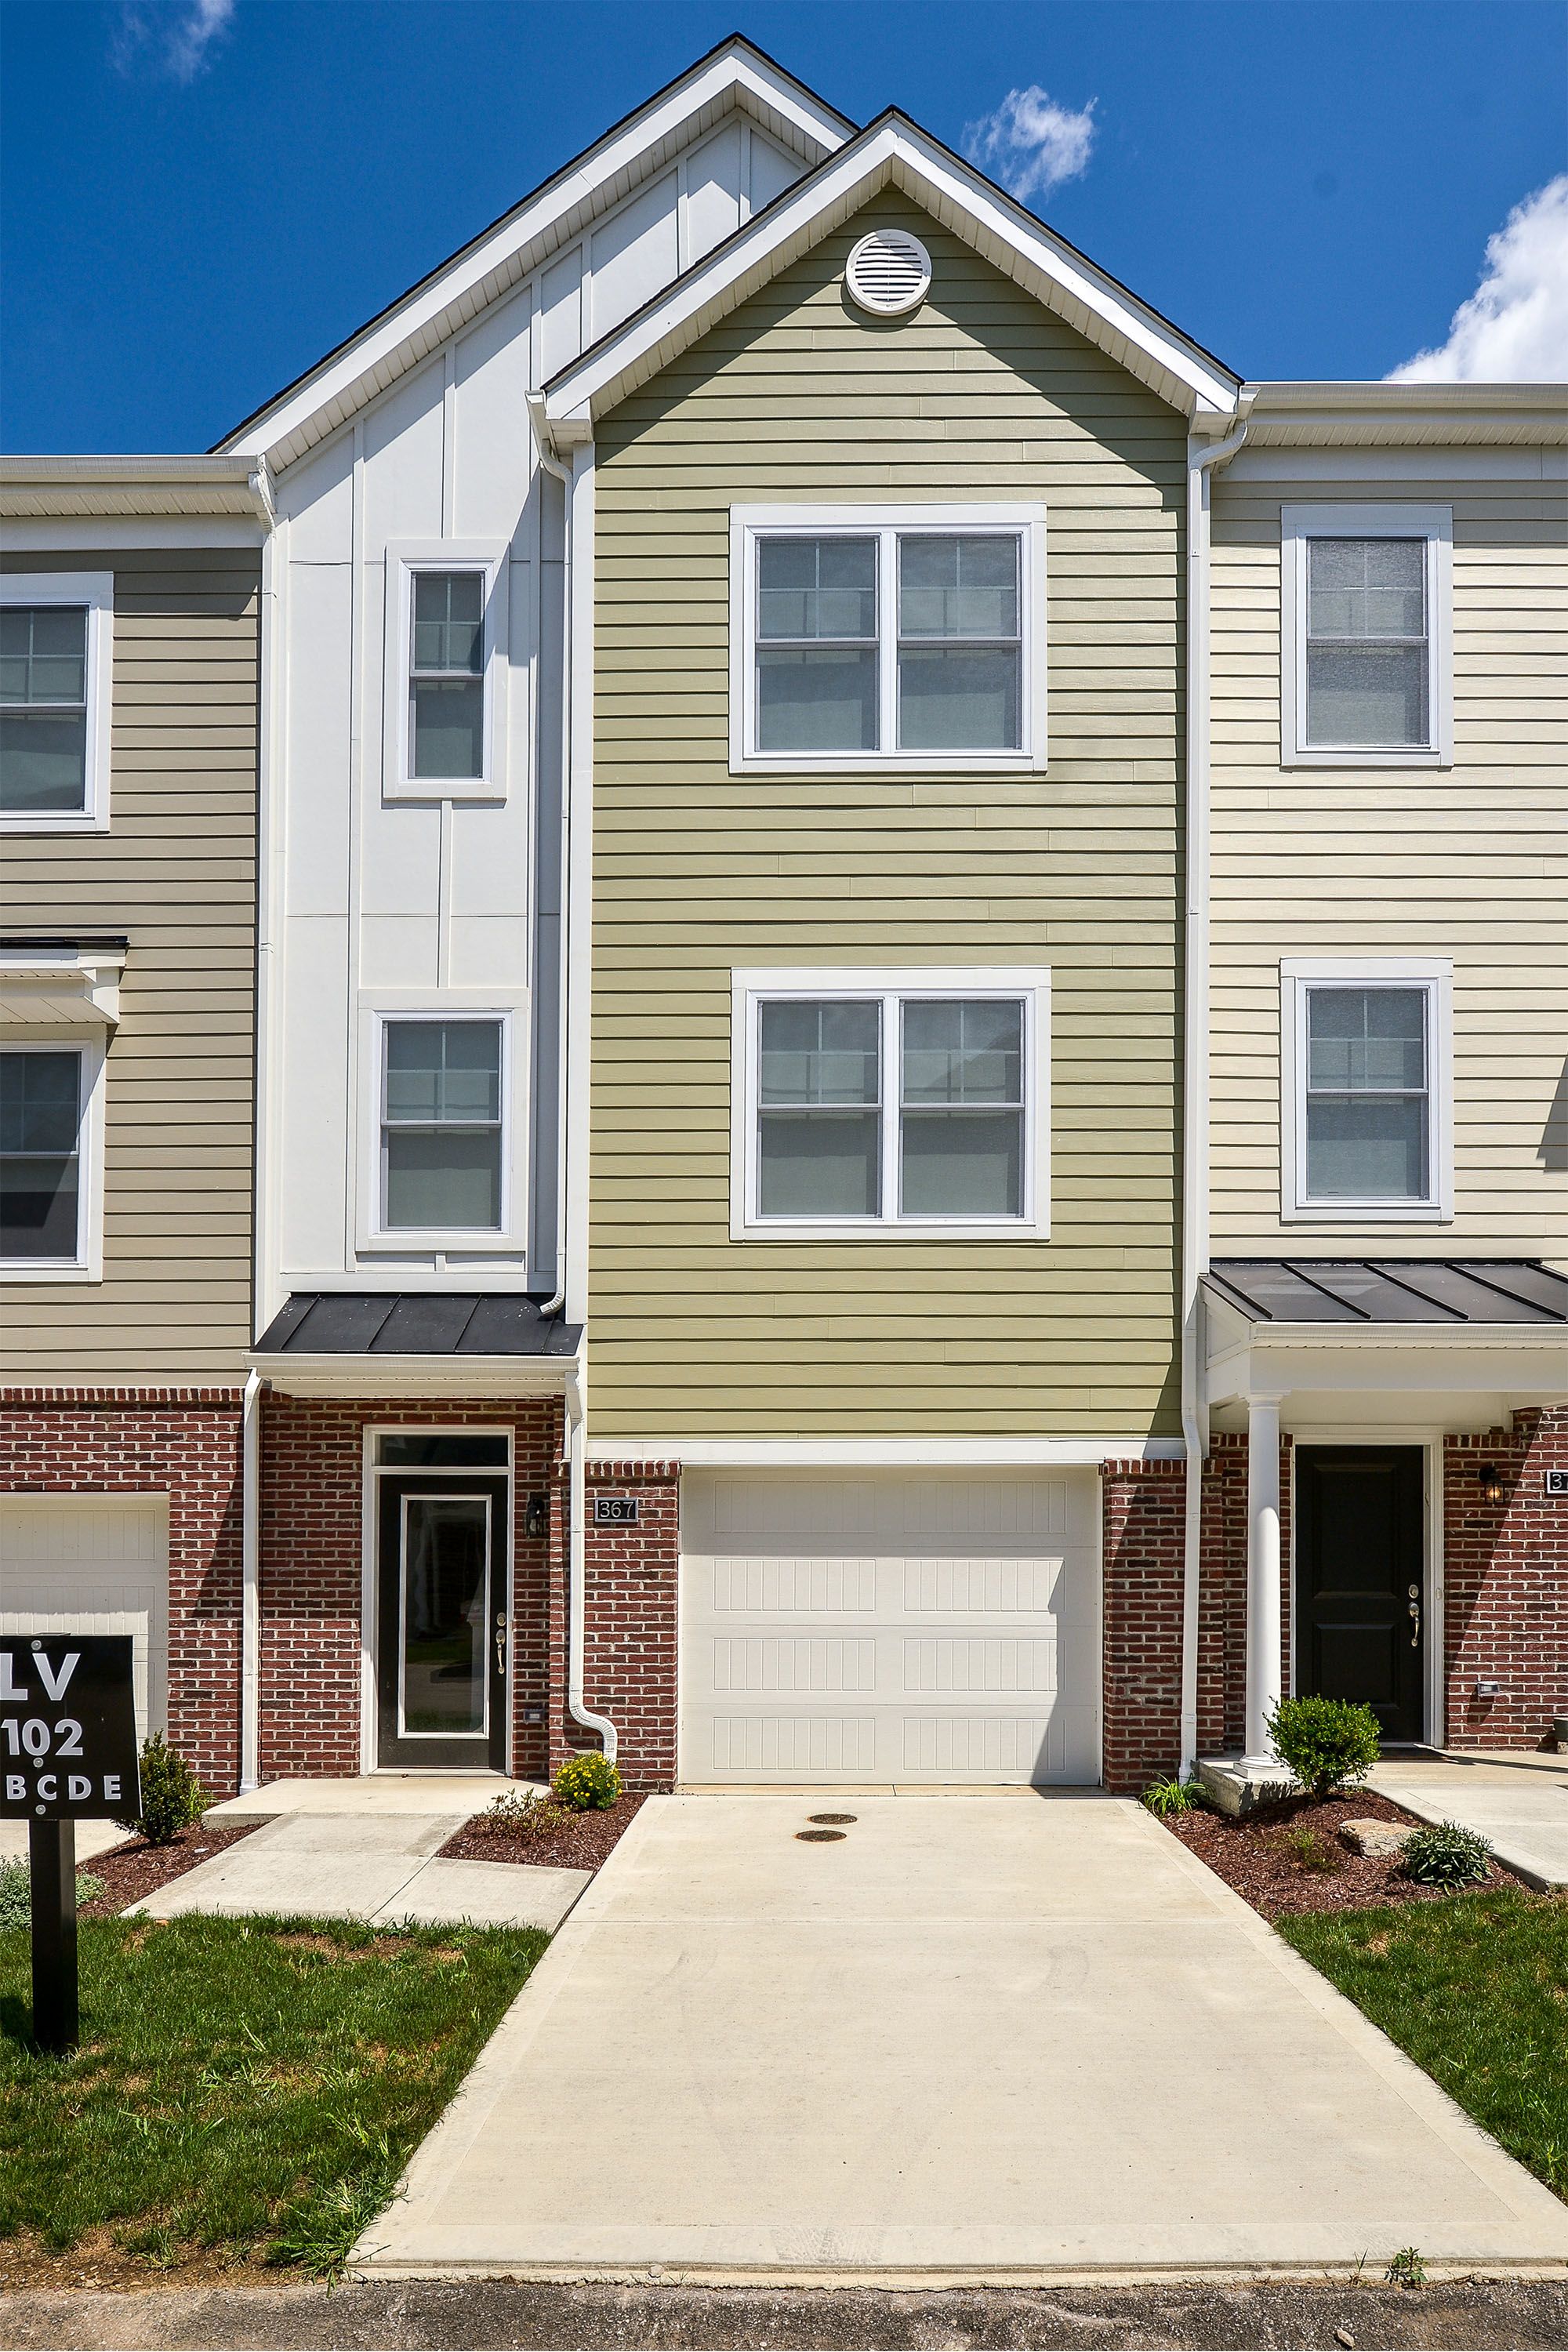
New Townhouses from Walnut Capital
New Townhouses from Walnut Capital
Home Values
From 2000 to 2011 the media home value almost tripled, from $40,000-$50,000 in 2000 to $100,000-$125,000 in 2011. While the median home value didn't change from 2011 to 2017, there are more homes above the median value in 2017 than there were in 2011. There are fewer affordable or lower value homes, which means that some people likely had to move to avoid increased property taxes or higher rents.
Lastly we'll look at household income distributions for 2000, 2011, and 2017. It seems pretty apparent that after 2009 gentrification changed the landscape of Lawrenceville. Odds are good that median income has also risen because of the new residents that could afford the area.
Photo Credit
Household Incomes
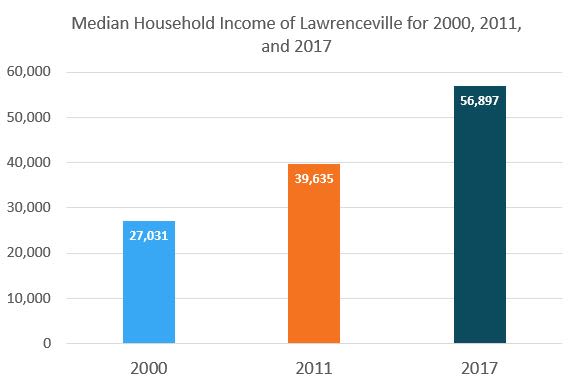
As home values increased and people moved out of the neighborhood they were replaced by people who could afford to live in Lawrenceville. Take a look at the distributions below and see just how the population of the neighborhood has changed.
The median income in 2000 was $27,031. In 2010 the median household income is $39,635 and then it jumps to $56,897. If you toggle through the years you can see the distribution also shifts from the left to the right, meaning that as a whole household incomes have increased.
Conclusion
Because of the decreased capacity, increased home values, and increased median incomes, we can definitely say that gentrification changed Lawrenceville, more for worse than for good. The decrease in population makes it clear that people left the neighborhood, and increased home values means that low income families likely had to move further out of the city. The drastic change in the household income distribution suggests that different people have moved into Lawrenceville.
This might have been avoided had some policies been in place to better protect citizens from the anticipated increase in property values. Some tactics that cities have used are land banking, enacting rent controls, and creating tax breaks for affected communities. Any policy that helps to combat displacement would be a good measure to explore for neighborhoods facing disruption from gentrification.
Photo Credit


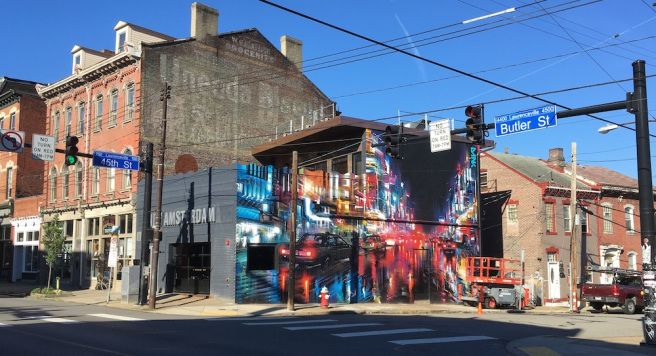
Murals can be found throughout Lawrenceville.
Murals can be found throughout Lawrenceville.
What You Can Do:
Reach out to your local representative , let them know that you want protections in place to combat displacement.
Join a community action group.
Let your voice be heard at a city council meeting.