Protecting Pedestrians
in Pittsburgh
What data tells us (and doesn't)


How Safe Are Pedestrians in Allegheny County?
“When it comes to number of deaths and the trendlines, [the U.S. is] number one—and not in a good way."
Compared to the nation at large, Allegheny County appears safe for pedestrians: According to a recent CDC report, Allegheny recorded about half of the national average for pedestrian deaths per 100,000 people in 2022 (the last year analyzed by the paper).

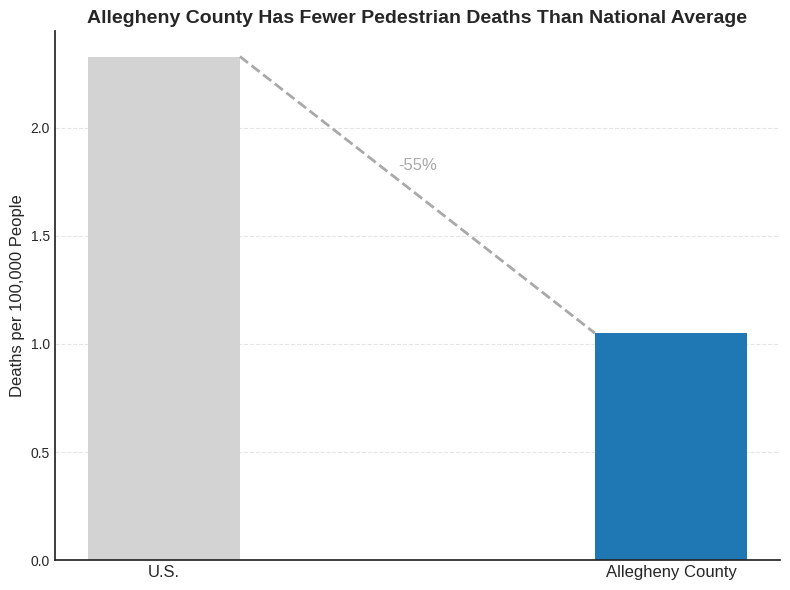
Data sources: "Pedestrian and Overall Road Traffic Crash Deaths — United States and 27 Other High-Income Countries, 2013–2022," U.S. Centers for Disease Control and Prevention; "Cumulative Crash Data," Western Pennsylvania Regional Data Center
Data sources: "Pedestrian and Overall Road Traffic Crash Deaths — United States and 27 Other High-Income Countries, 2013–2022," U.S. Centers for Disease Control and Prevention; "Cumulative Crash Data," Western Pennsylvania Regional Data Center
This news is not cause for celebration.
Allegheny County performs comparatively well in these metrics only because the United States performs so poorly. The same report showed that pedestrian deaths from traffic collisions increased 50% from 2013–2022 in the U.S.—Meanwhile, all other high-income countries in the same time period saw a 25% decrease in pedestrian fatalities.
The Reality: One Fatality is Too Many
About 13 pedestrians are killed in traffic collisions every year in Allegheny County. Although collisions involving pedestrians have decreased on average since 2010 in Allegheny County, the number has been steadily increasing in the last six years.

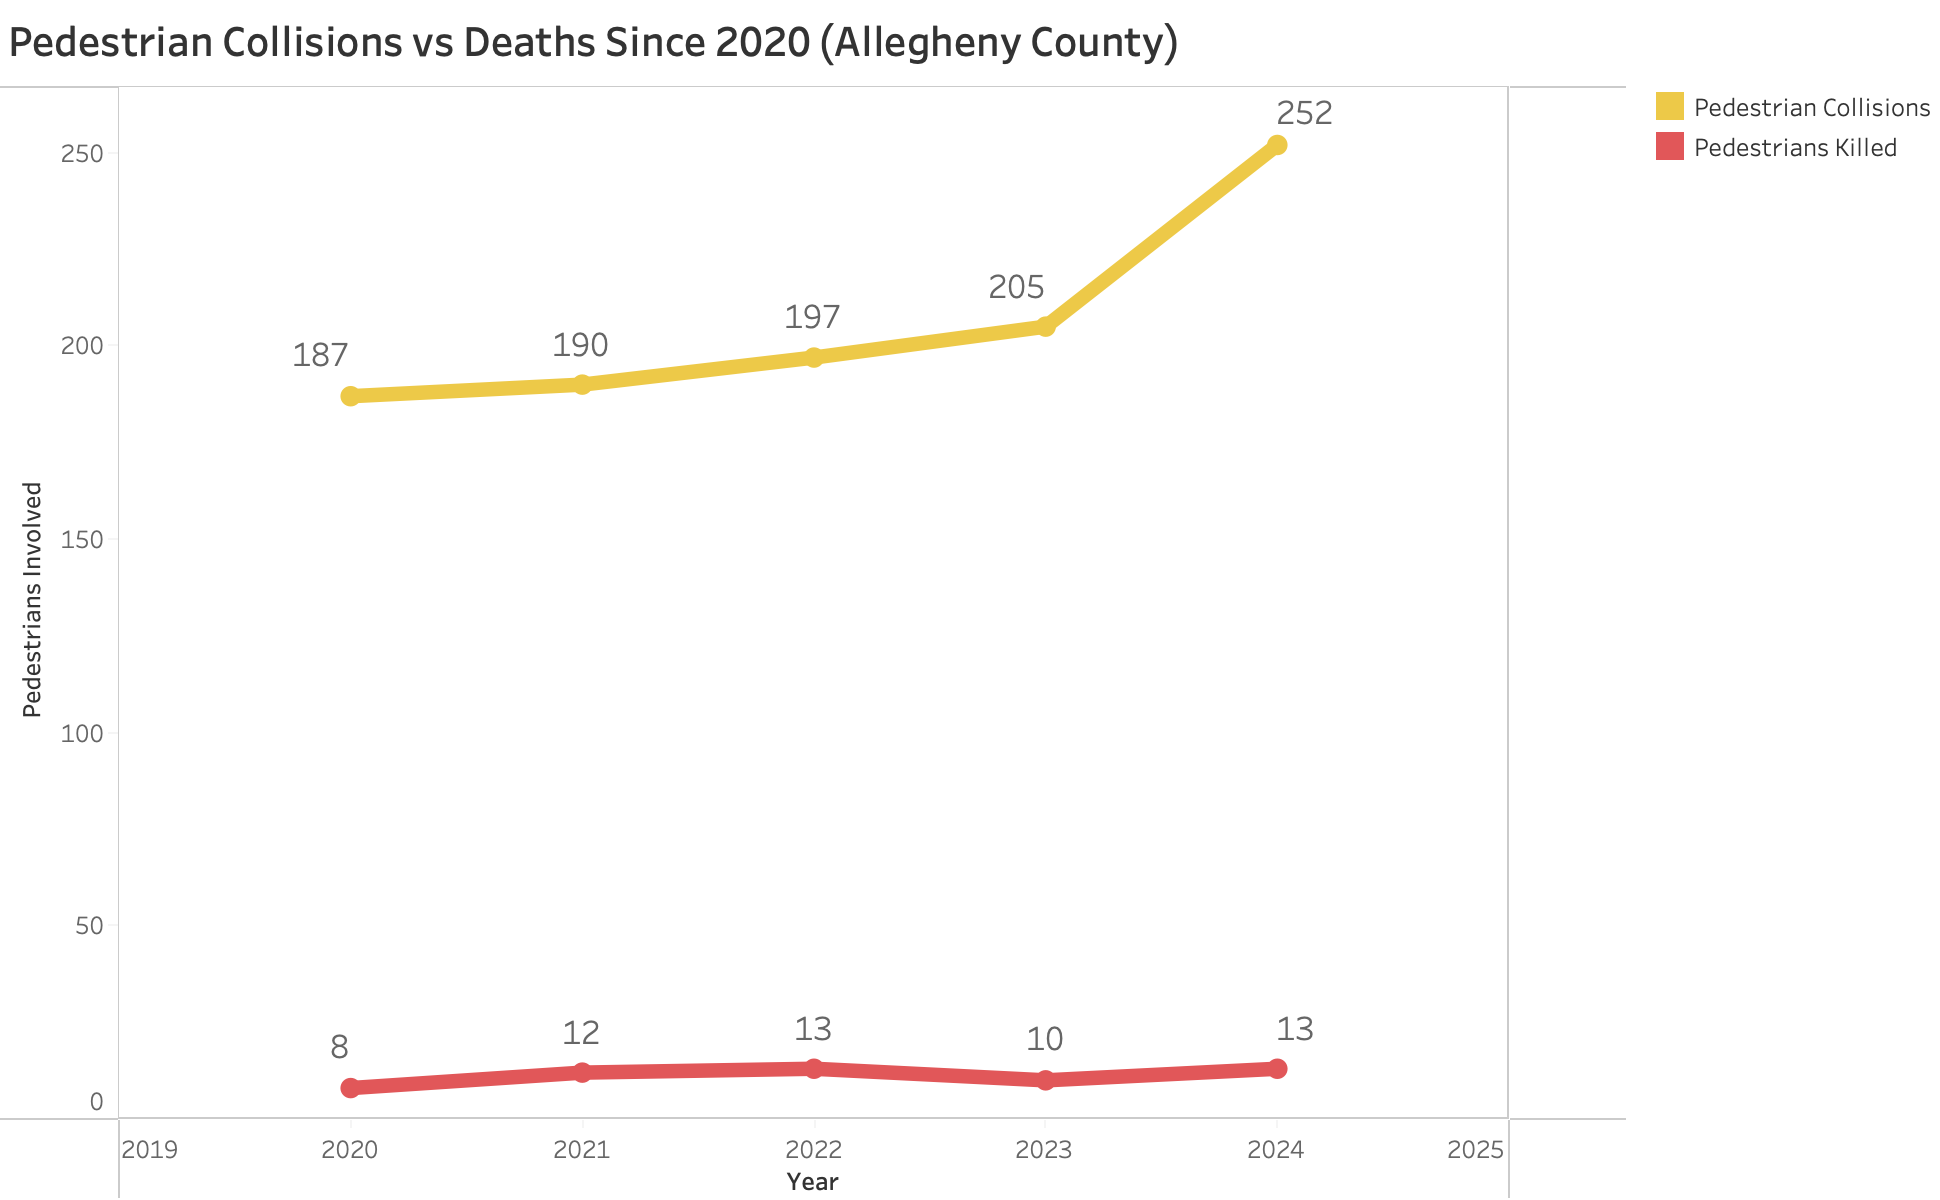
Data source: Cumulative Crash Data, Western Pennsylvania Regional Data Center
Data source: Cumulative Crash Data, Western Pennsylvania Regional Data Center


These numbers hit close to home.
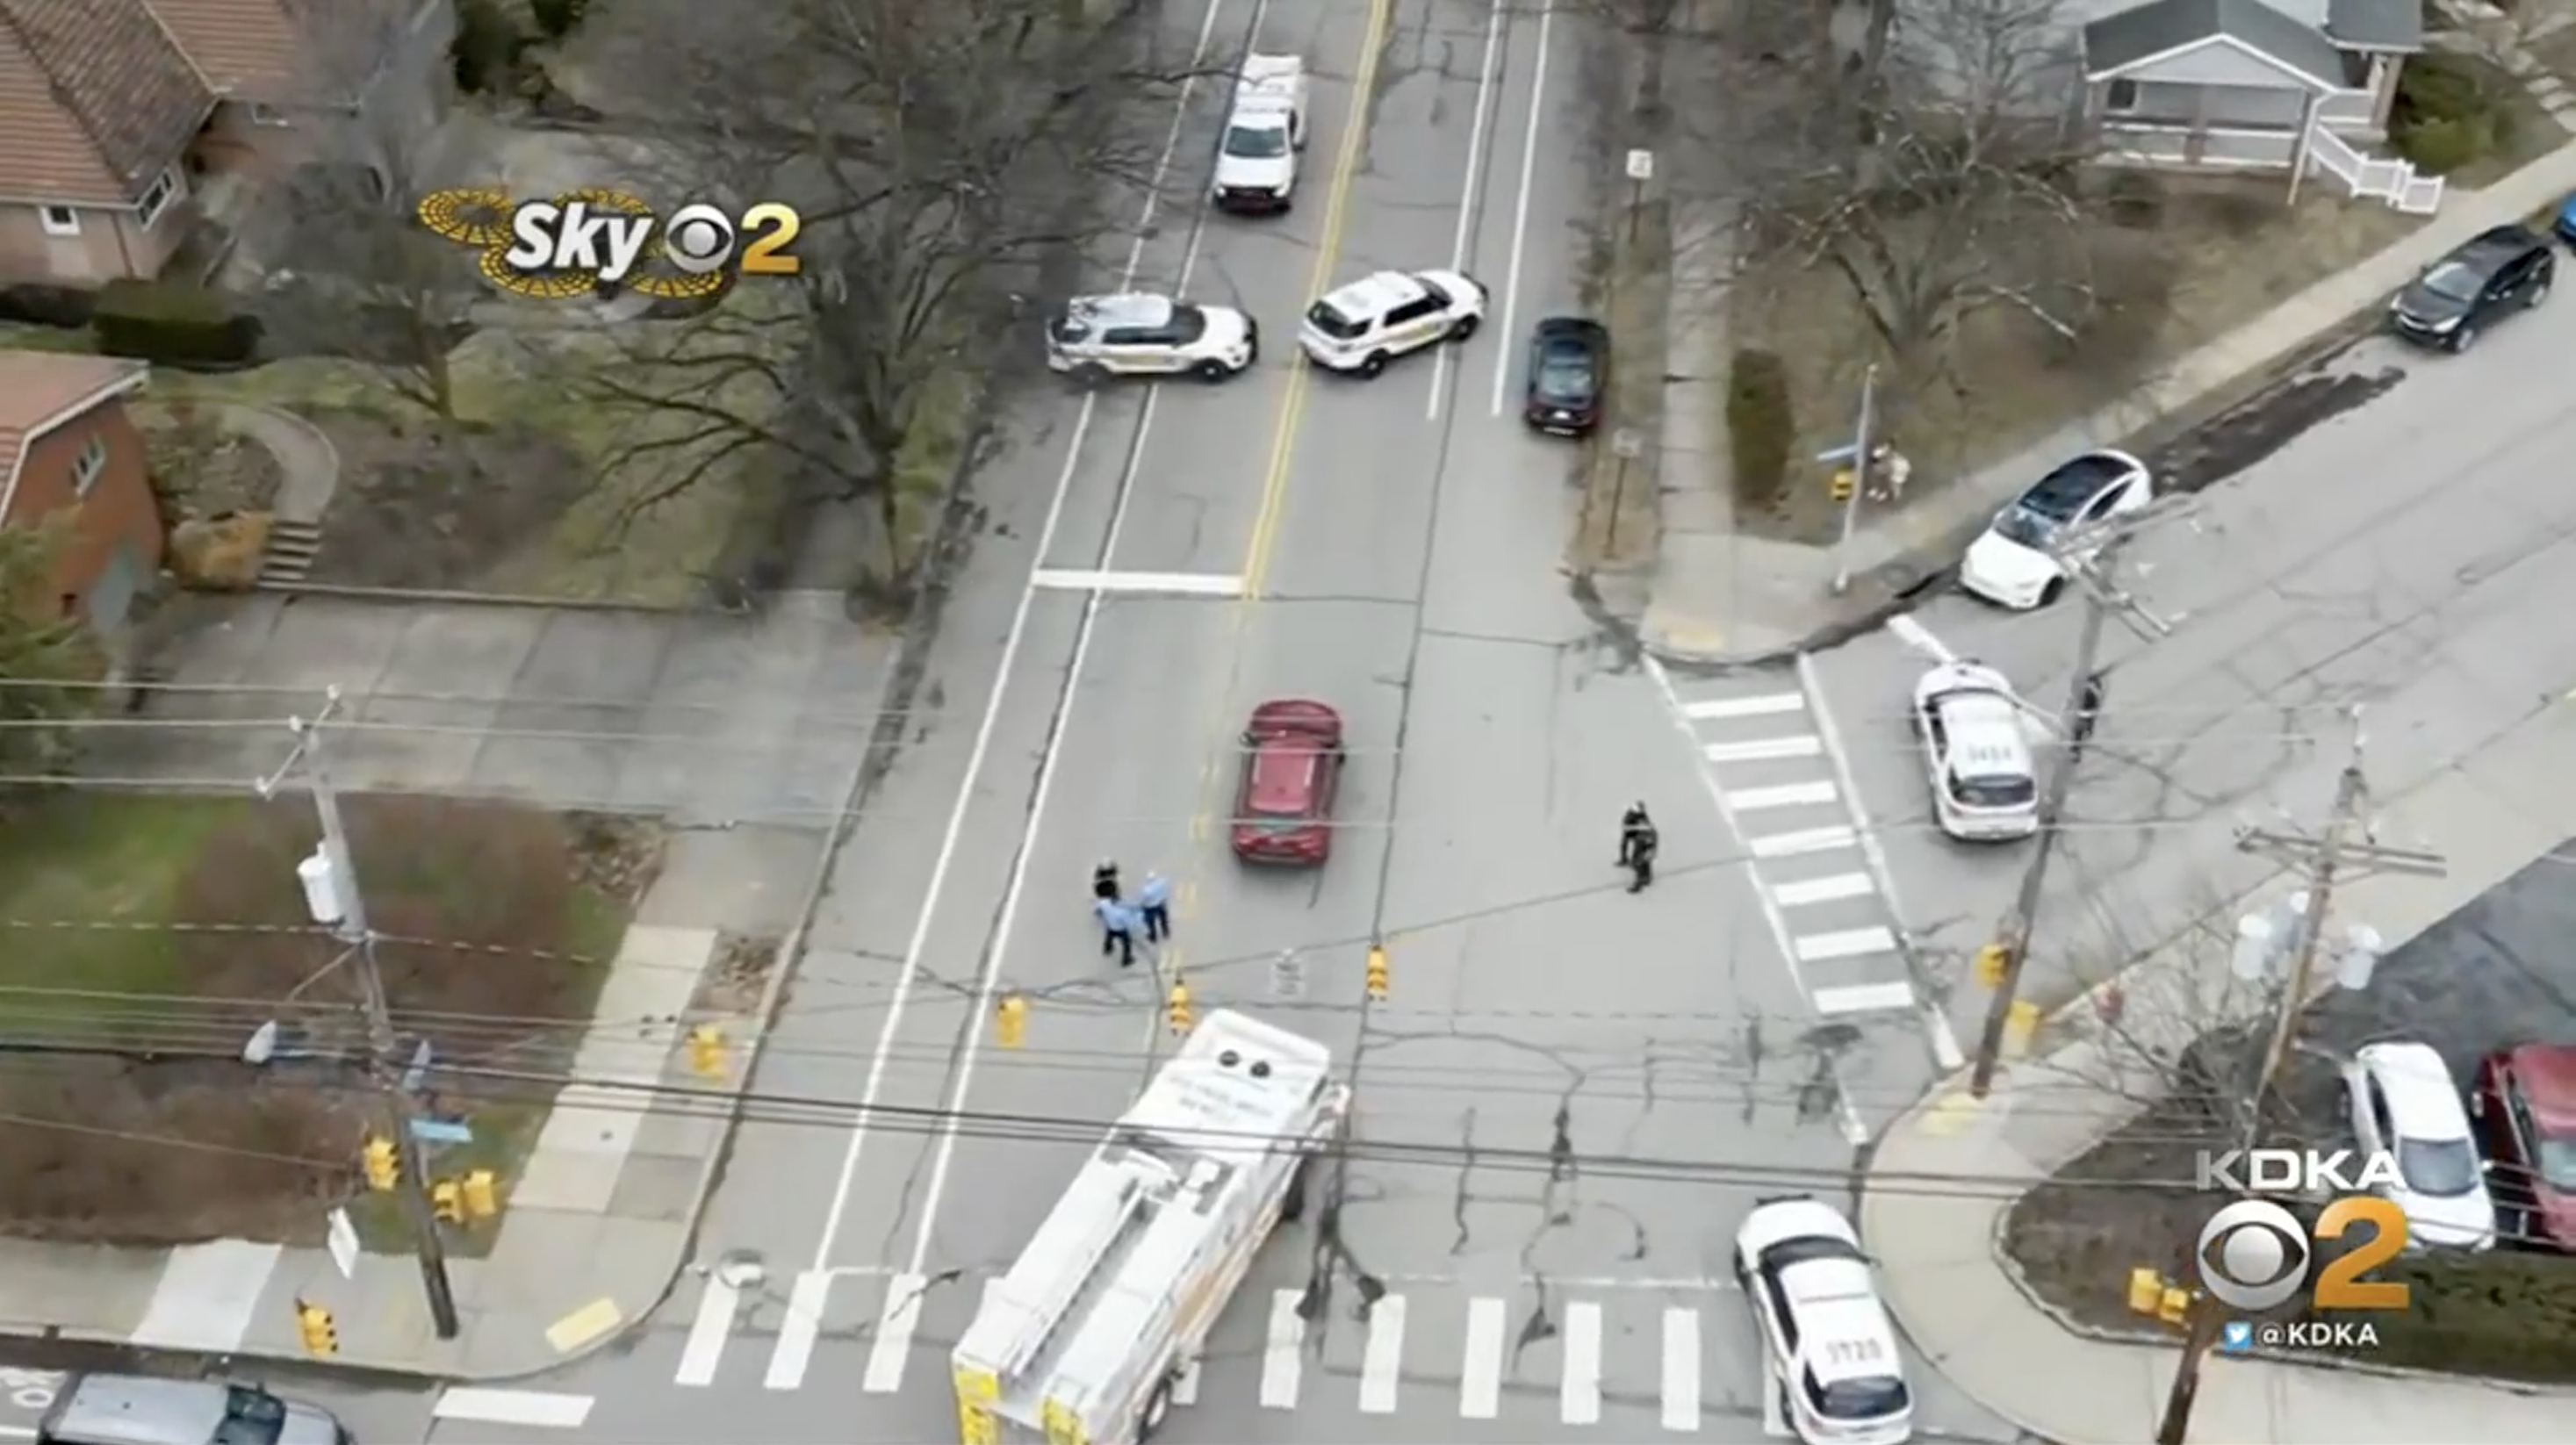
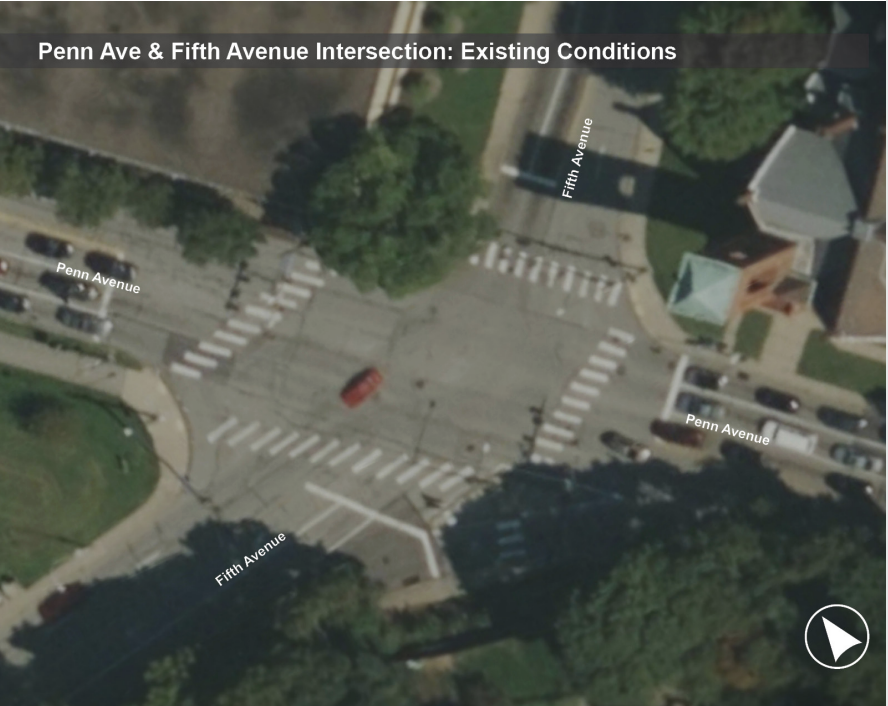
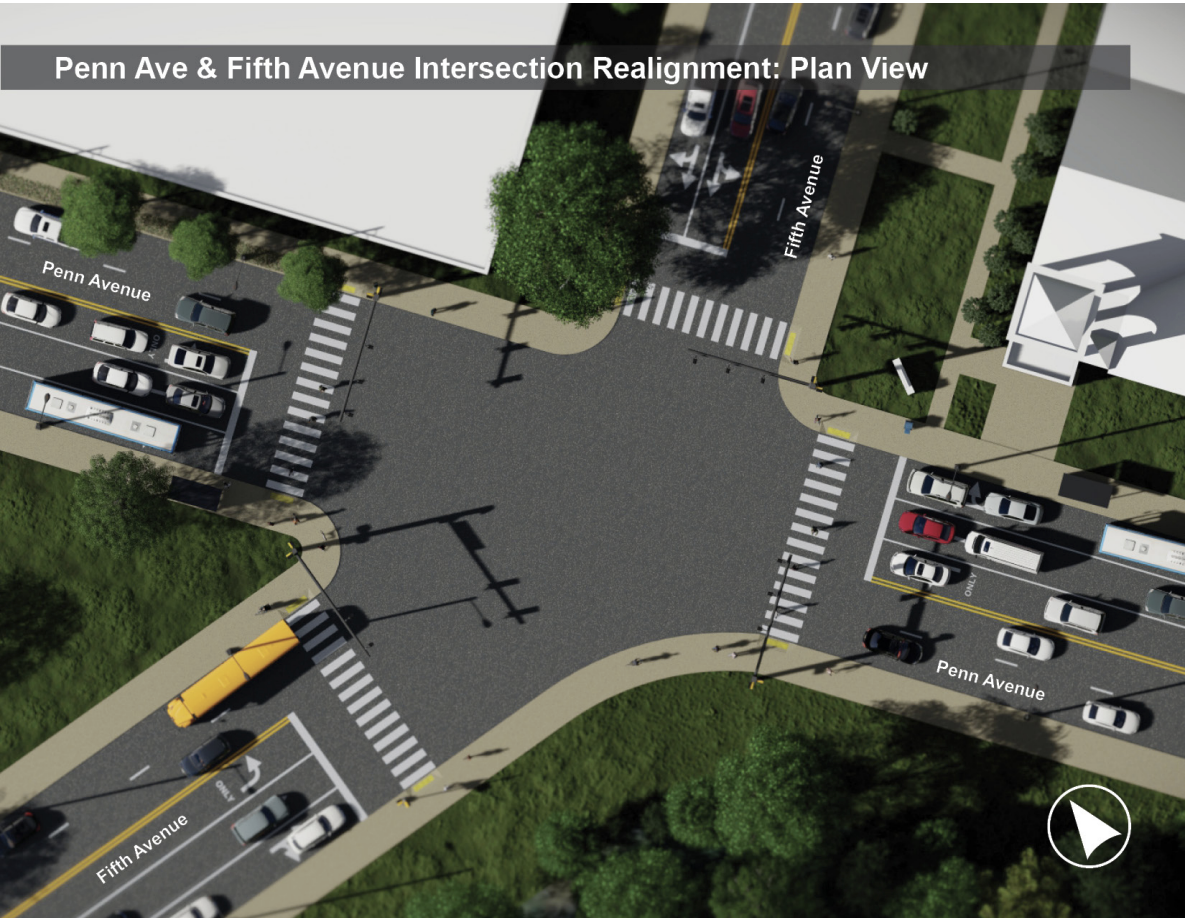
Just a few years ago, a woman around my age was struck and killed by a vehicle in a five-way intersection that I walk through every day.
Even with bold road markings and a pedestrian walk signal, this intersection is dangerous.
It’s just one of many.
Current Measures
Aren’t Enough
The majority of pedestrian-related collisions took place in intersections, most of which already utilized traffic signals. This was true at all times of day (daylight and non-daylight hours).
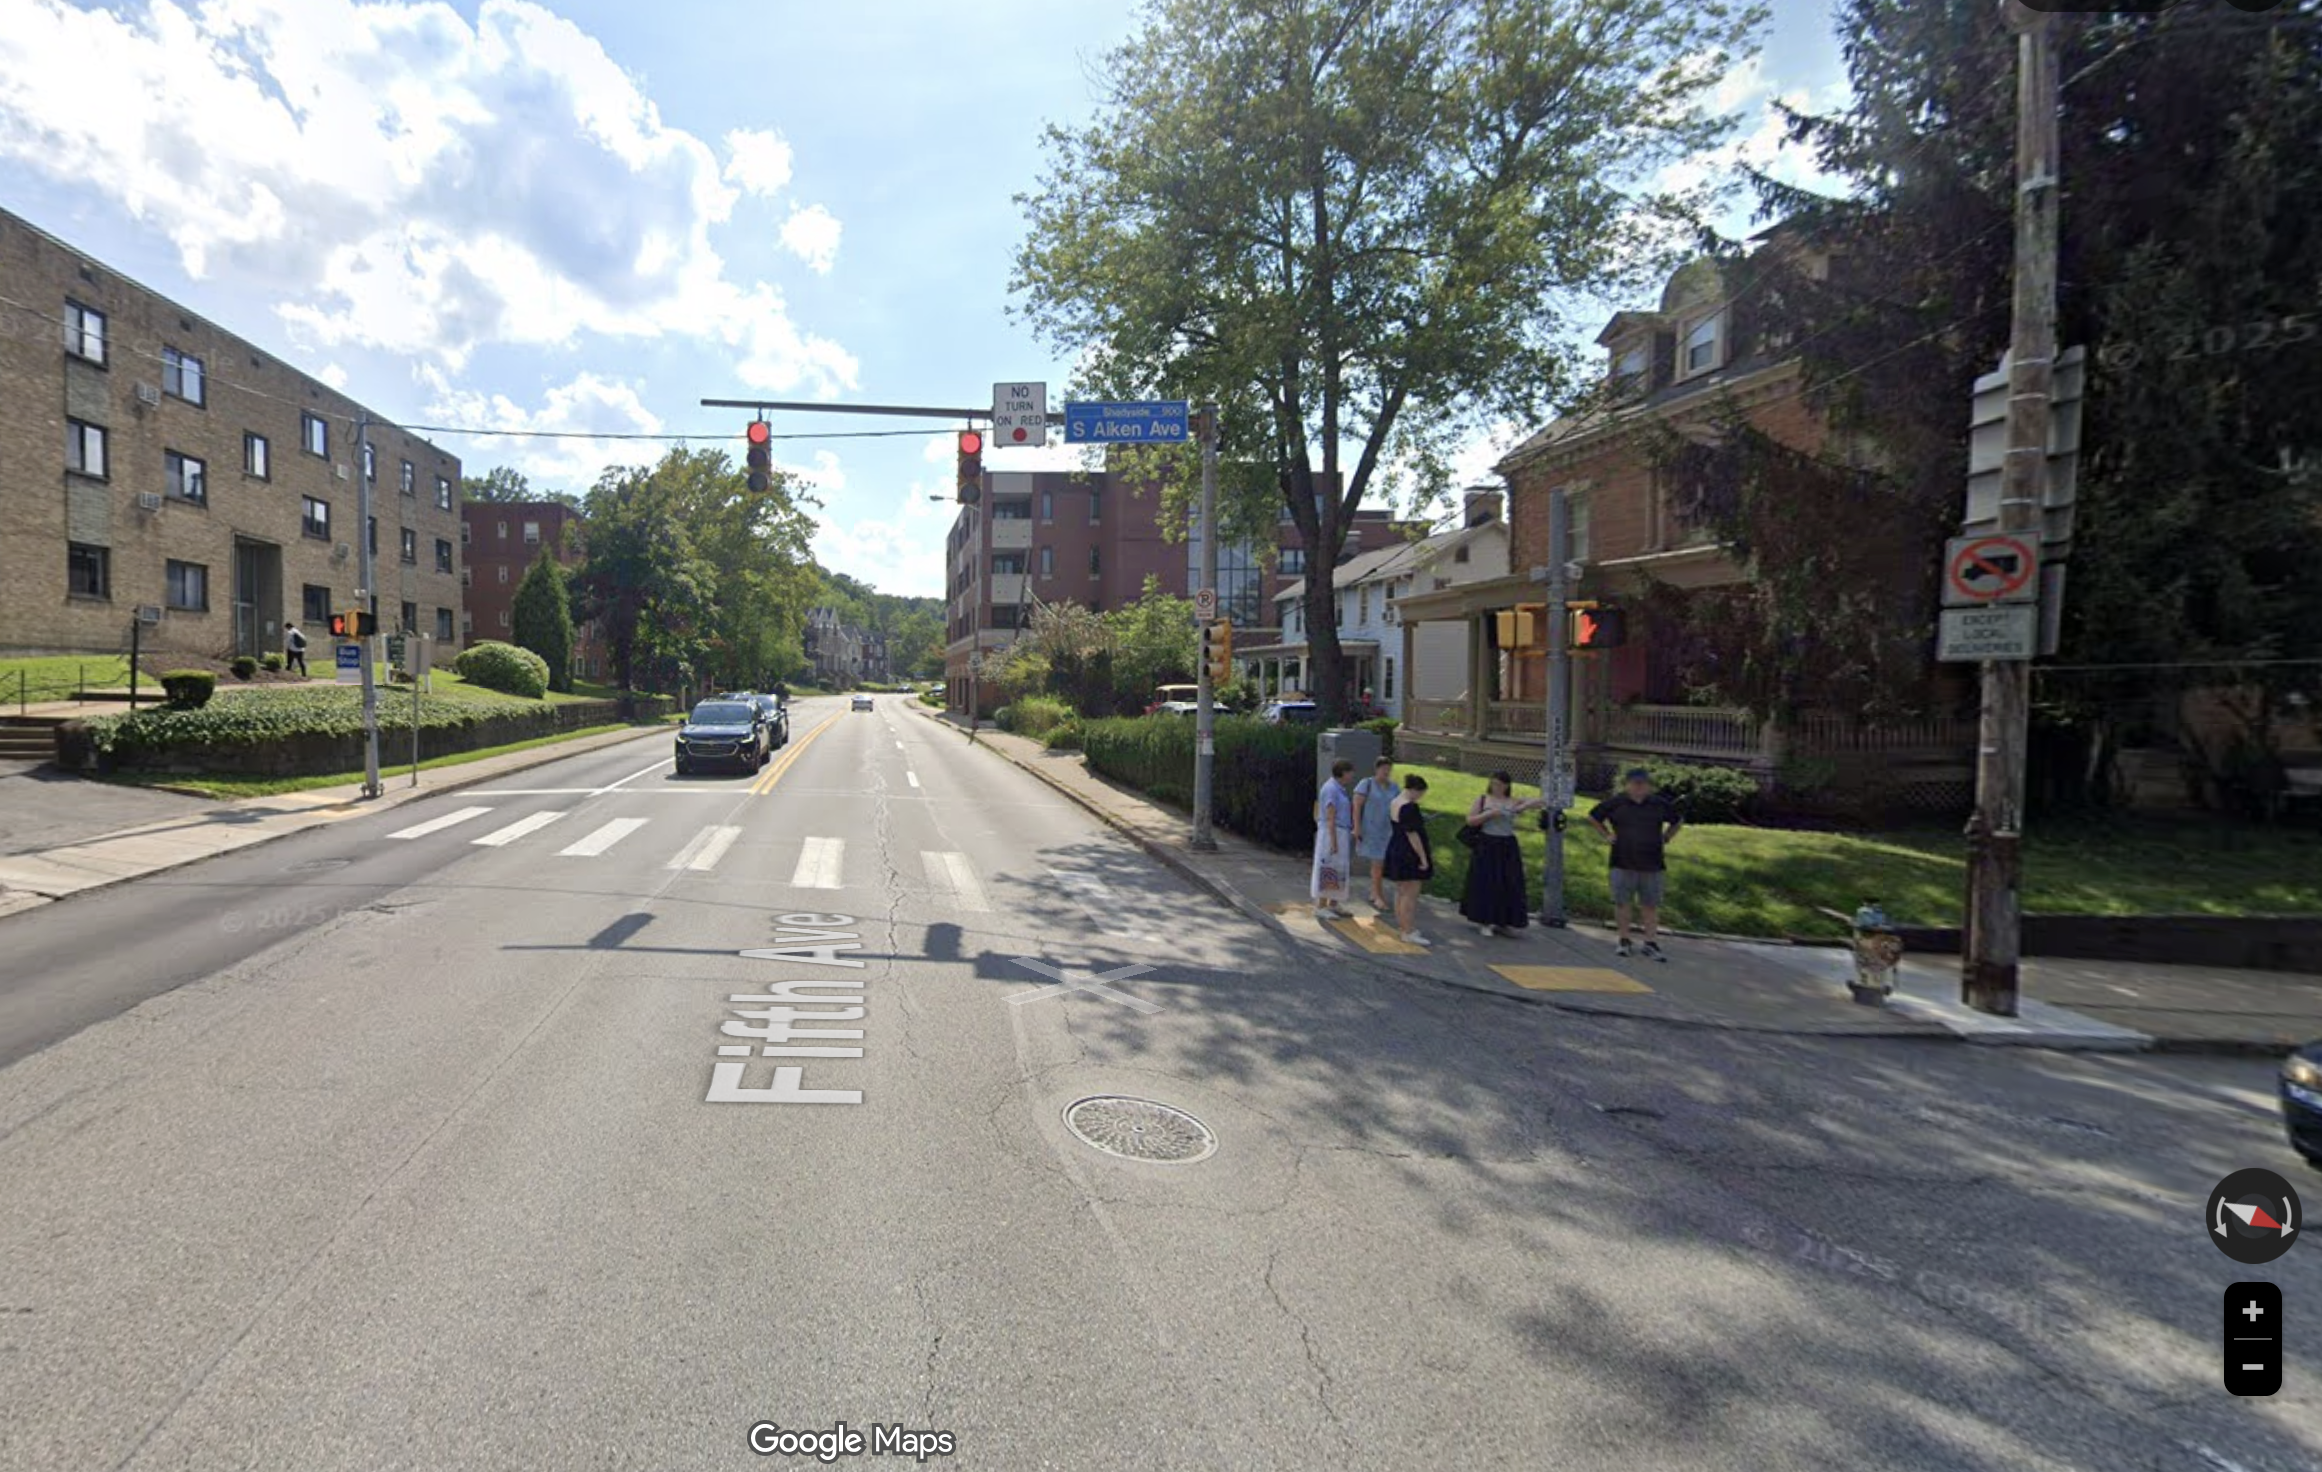
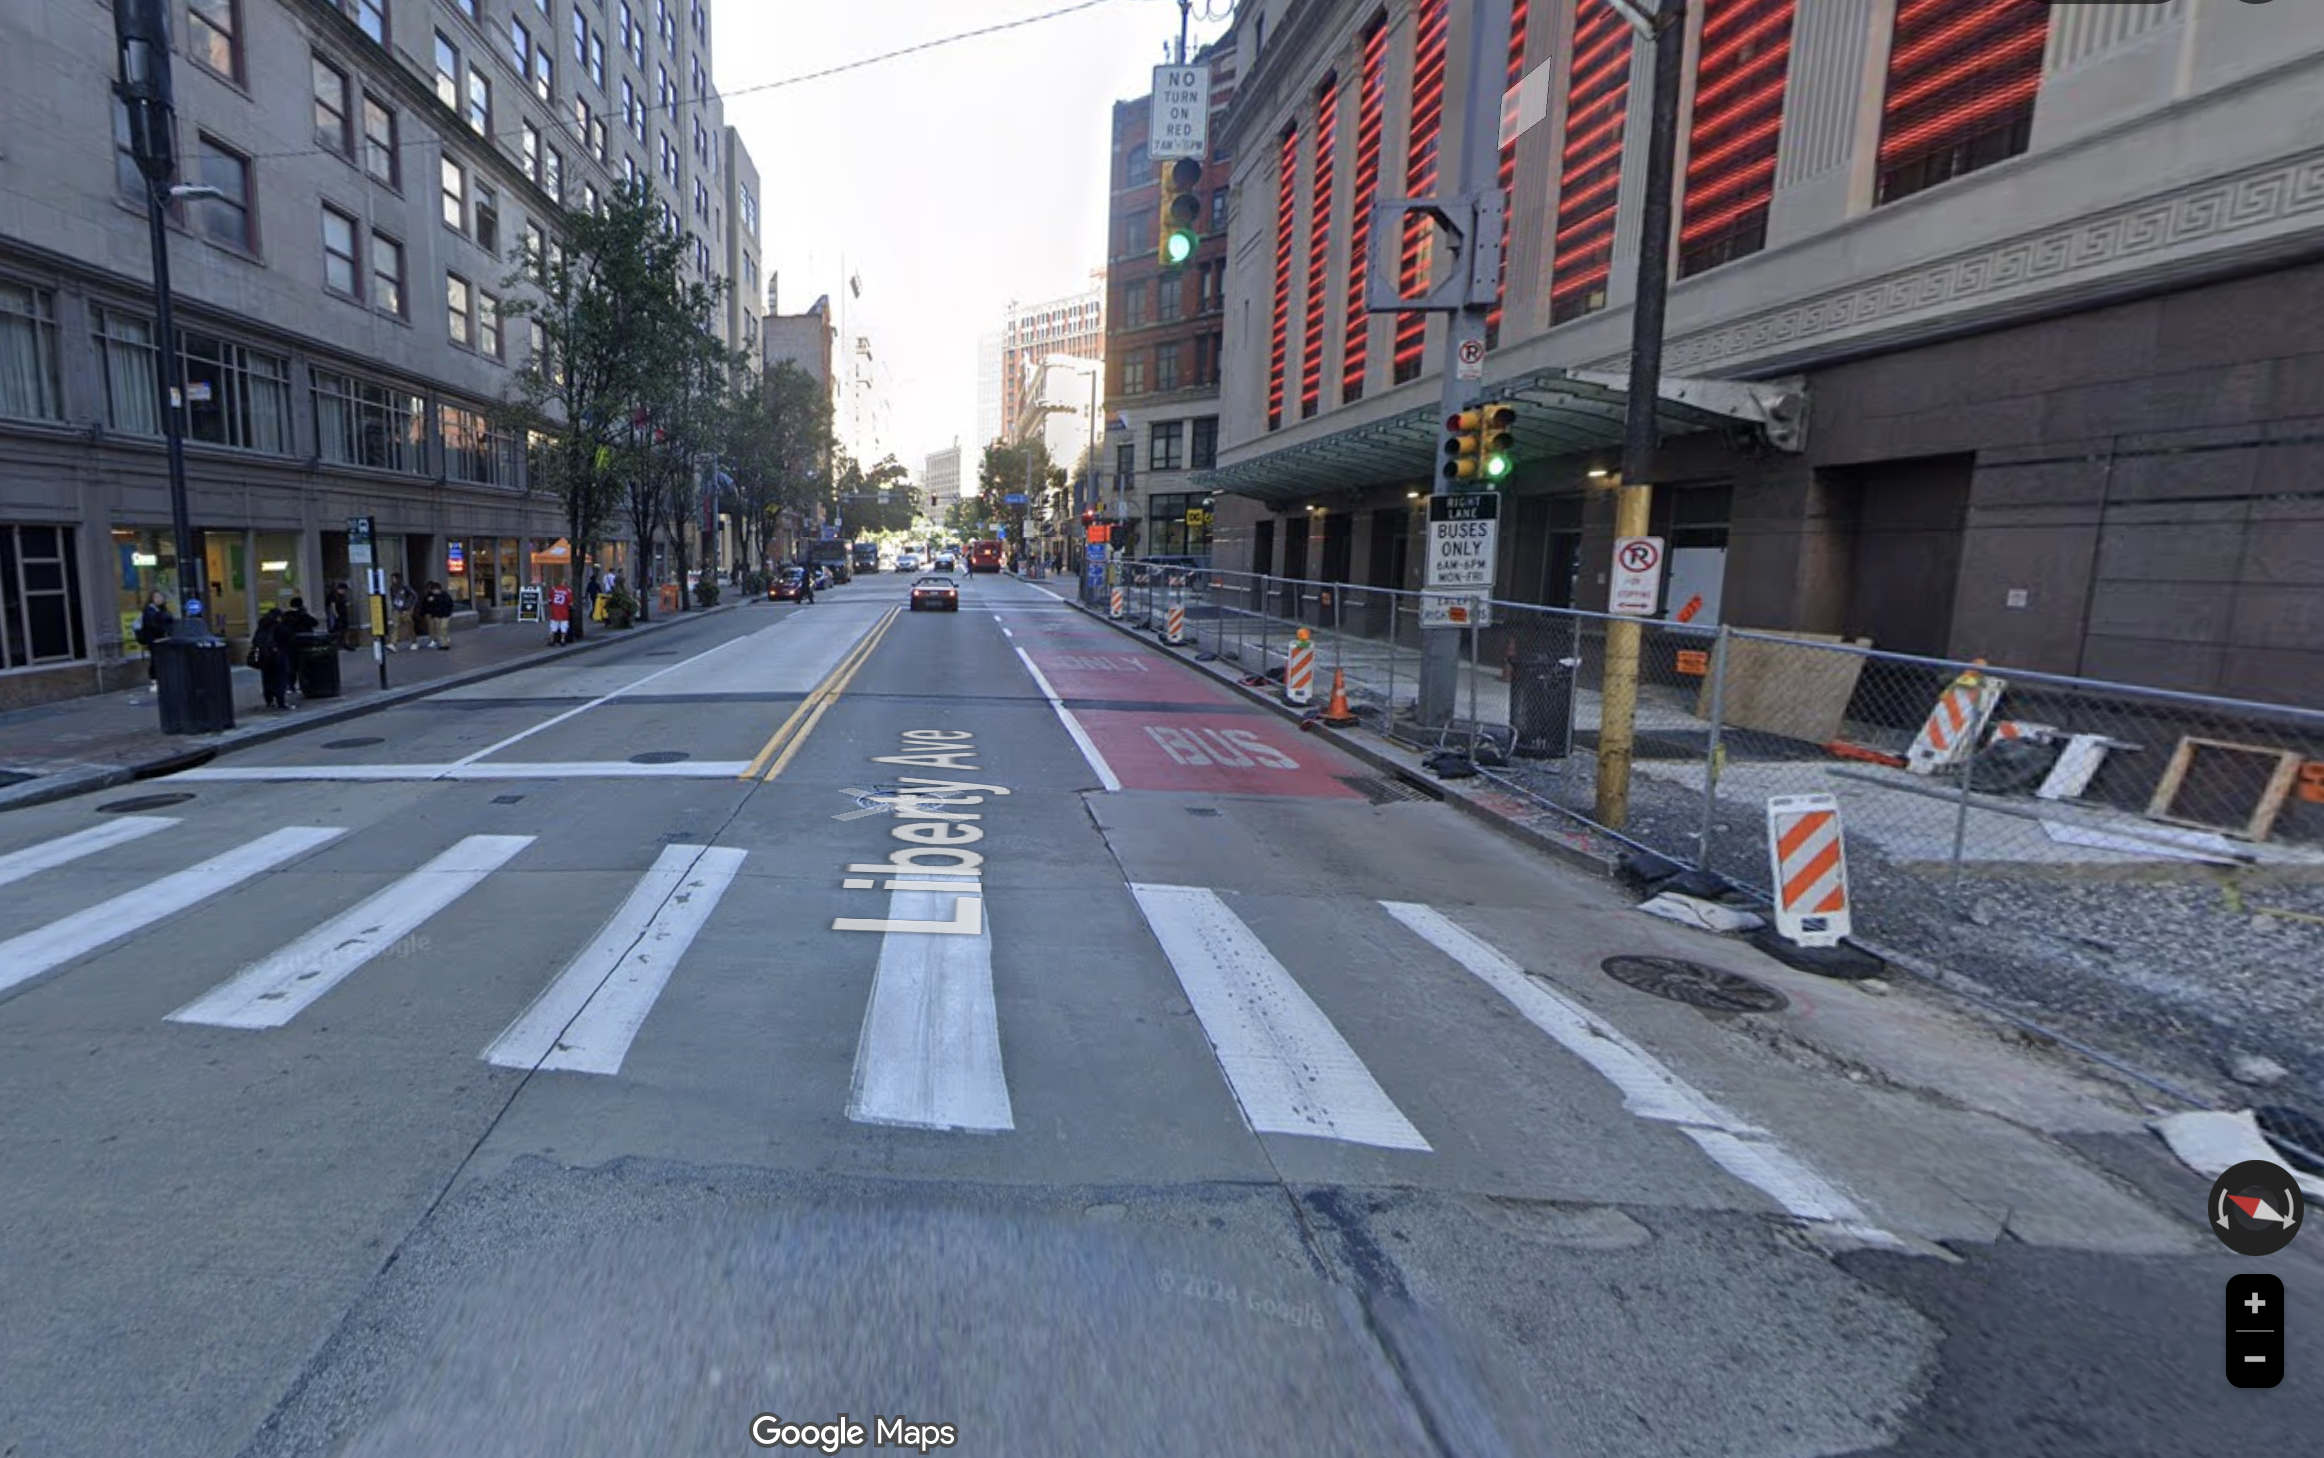
Pittsburgh's highest-risk intersections, which each recorded collisions with at least 12–18 pedestrians between 2024–2024, have two things in common:
1) They are in high-traffic areas for pedestrians.
2) They all contain traffic signals and intersection markings.

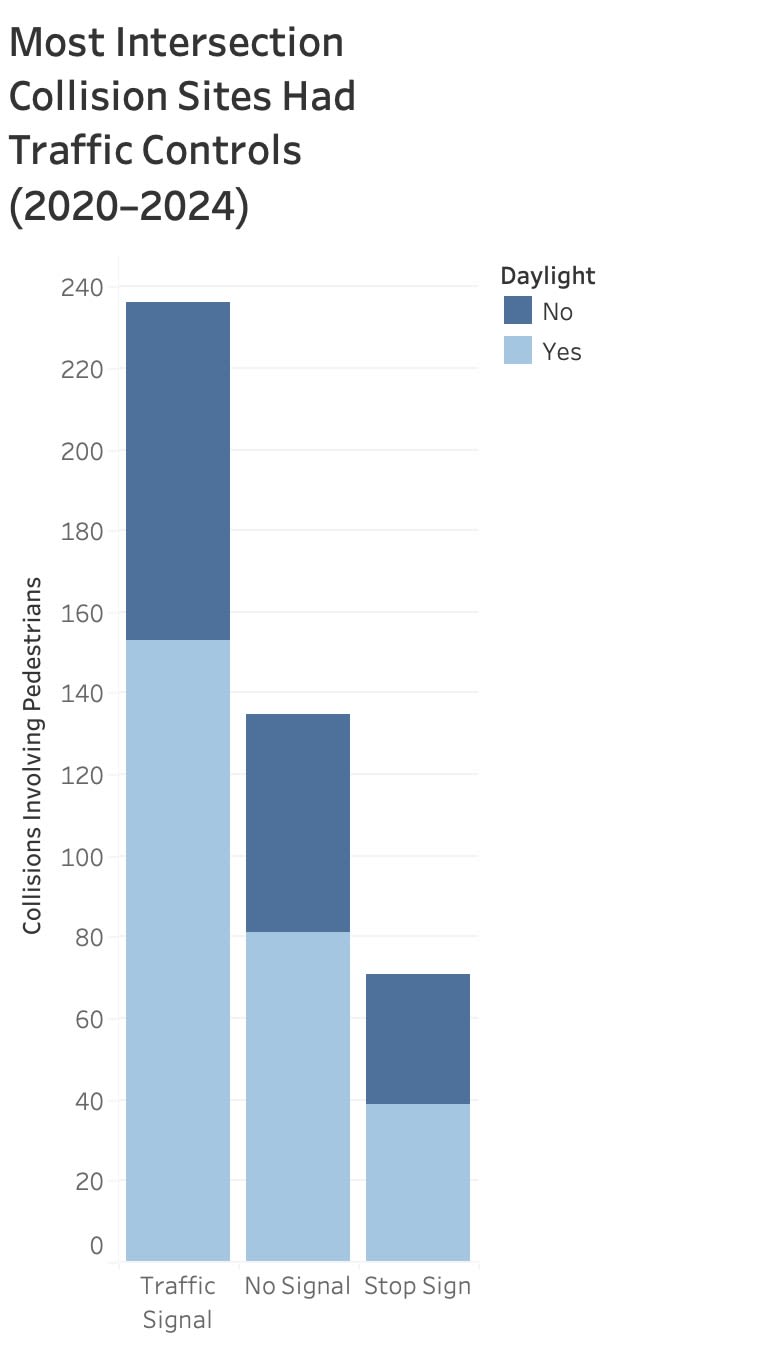
Data source: Cumulative Crash Data, Western Pennsylvania Regional Data Center
Data source: Cumulative Crash Data, Western Pennsylvania Regional Data Center

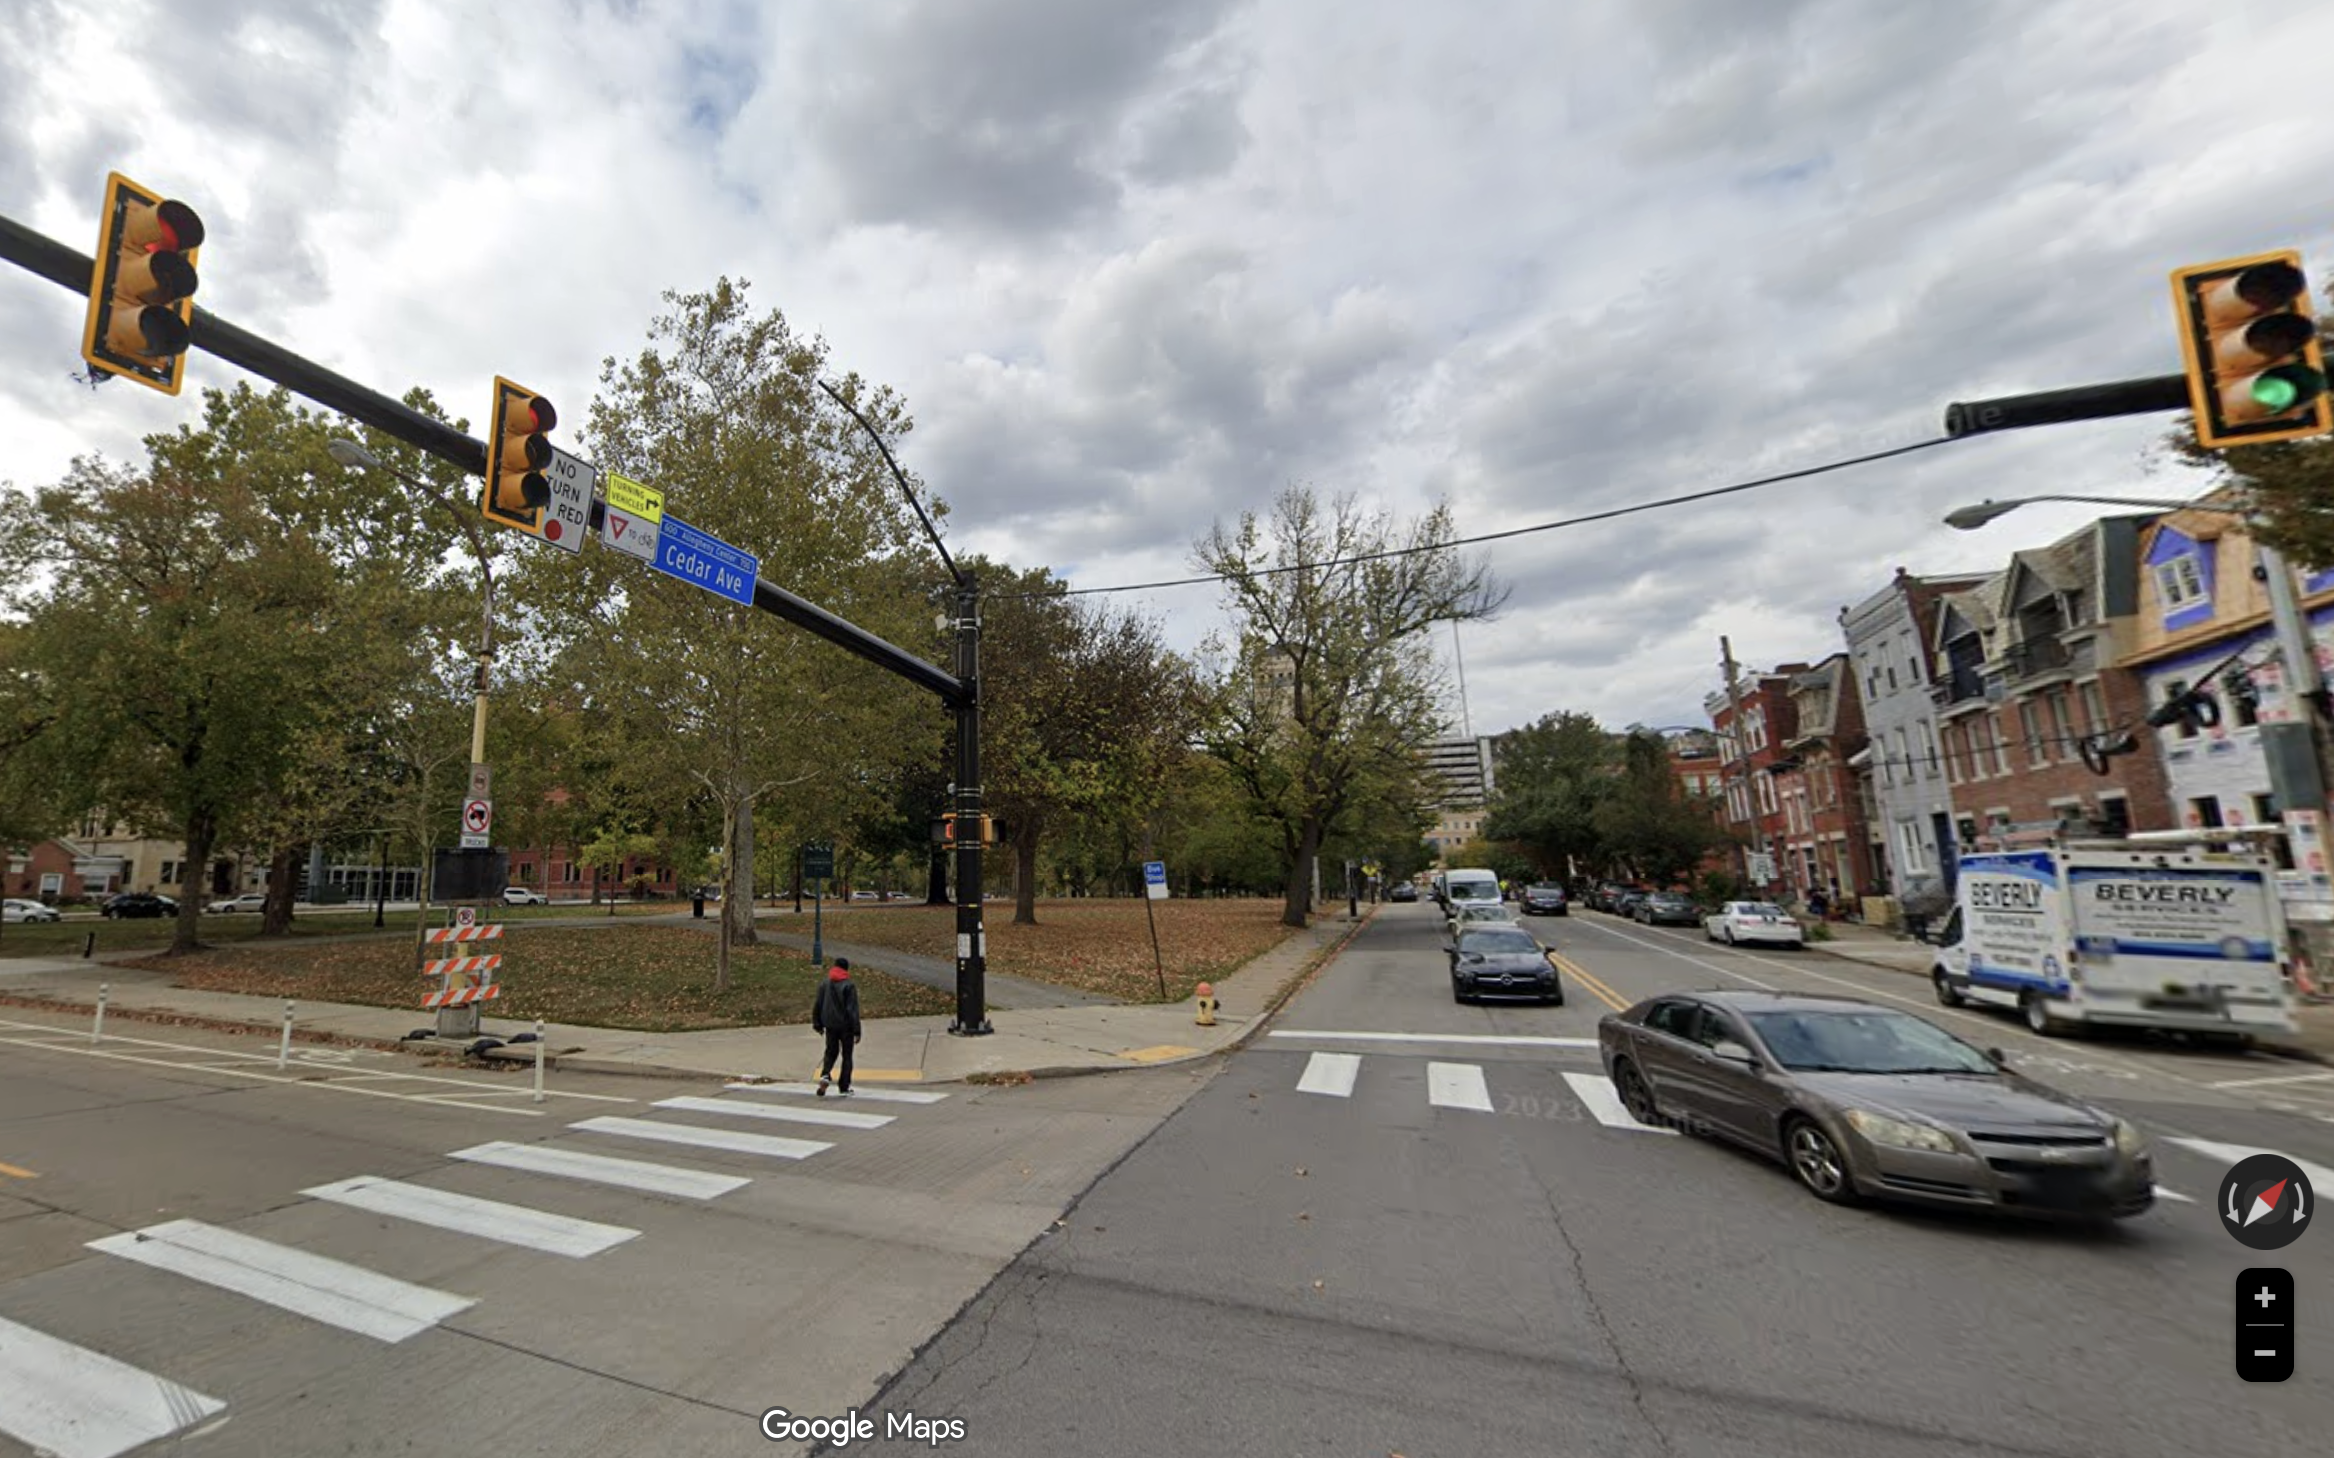


E. Ohio & Cedar Ave
(near the Children's Museum)
18 pedestrian collisions from 2004–2024
Fifth Ave & S Aiken Ave
(Shadyside)
17 pedestrian collisions from 2004–2024
Liberty Ave & 7th St
(Downtown)
14 pedestrian collisions from 2004–2024.
This infrastructure is in place to protect pedestrians. Why are intersections still so dangerous?
Data source: Cumulative Crash Data, Western Pennsylvania Regional Data Center
Strategies for a
Car-Centric County
Instead of thinking about controlling cars better, Americans need to think about mode shift—reducing the number of people who need to travel by car at all.
The most effective way to reduce traffic collisions with pedestrians would be to reduce the number of cars on the road—increasing public transportation availability and car-free spaces. Without that reality, Allegheny County and the City of Pittsburgh, in collaboration with Pennsylvania Department of Transportation, have committed to the Vision Zero , an international initiative with the goal of eliminating traffic fatalities.
From this initiative, Allegheny County entered a 17-month process to develop a data-driven Comprehensive Safety Action Plan with “a goal to work toward zero traffic fatalities and serious injuries in Allegheny County by 2050.” The plan identifies intersections as the greatest safety emphasis area and details the county’s proposed changes for some of the highest risk corridors.
There is No One-Size-Fits-All Solution
Despite the promising and collaborative work at the city and county level, officials are met with an overwhelming number of possible solutions to increase safety.
The Comprehensive Safety Action Plan alone outlines
42 possible countermeasures
to address traffic safety issues.
Of these, select pedestrian-oriented measures include:
Furthermore, a paper coauthored by professor Nick Ferenchak found that only 1 out of 18 Vision Zero cities examined reduced pedestrian deaths.
Despite having years of data to comb through, cities like Pittsburgh may struggle in applying effective solutions, especially when car dependence can’t be curbed.


PennDot Can
Drive Data Forward
Even with comprehensive research and solution options, some notable information is missing from the Pennsylvania Department of Transportation's historical crash data that could potentially lead to more targeted changes in proposed infrastructure for future developments within Allegheny County’s plan.
Looking toward the future, Pennsylvania Department of Transportation (PennDOT) could expand collision data collection to look at specific information that pertains to intersection infrastructure such as:
Crosswalk length
Signal sequencing
Left- and right-turn radius
Additionally, the county and PennDOT can continue gathering first-hand community input about roadway safety on an ongoing basis like they did for a limited time in the Interactive Engagement Map.
These changes would better allow officials to see the streets from a pedestrian’s perspective and identify which changes could have the greatest impact.
References
Allegheny County Vision Zero. Allegheny County Comprehensive Safety Action Plan [Draft]. Accessed April 24, 2026. https://www.spcregion.org/wp-content/uploads/2026/03/Allegheny-County-CSAP_2026-03-27_DRAFT-FINAL.pdf
Allegheny County Vision Zero. “Allegheny County Safety Action Plan.” https://engagekh.mysocialpinpoint.com/alleghenycountyactionplan
Google Maps. "Street View of 40.45330048, -80.00170135." Accessed April 16, 2026.
Google Maps. "Street View of 40.44839859, -79.93419647." Accessed April 16, 2026.
Google Maps. "Street View of 40.44240189, -79.99990082." Accessed April 16, 2026.
Naumann, R.B., West, B.A., Barry, V., Matthews, S., Lee, R. “Pedestrian and Overall Road Traffic Crash Deaths — United States and 27 Other High-Income Countries, 2013–2022.” Morbidity and Mortality Weekly Report no. 74 (2025):134–139. http://dx.doi.org/10.15585/mmwr.mm7408a2
Pennsylvania Department of Transportation. Cumulative Crash Data. Distributed by Western Pennsylvania Regional Data Center. https://data.wprdc.org/dataset/allegheny-county-crash-data
Zipper, David. “Searching for the ‘Smoking Gun’ in US Pedestrian Deaths.” Bloomberg, April 14, 2026. https://www.bloomberg.com/news/articles/2026-04-14/what-s-really-driving-the-pedestrian-safety-crisis-in-us-cities?srnd=phx-citylab
AI Use
Claude.ai used for help in understanding and creating calculated fields and visualization options within Tableau
Copilot used to generate code for bar chart titled "Allegheny County Has Fewer Pedestrian Deaths Than National Average" using data from “Cumulative Crash Data” and “Pedestrian and Overall Road Traffic Crash Deaths — United States and 27 Other High-Income Countries, 2013–2022" (referenced above).